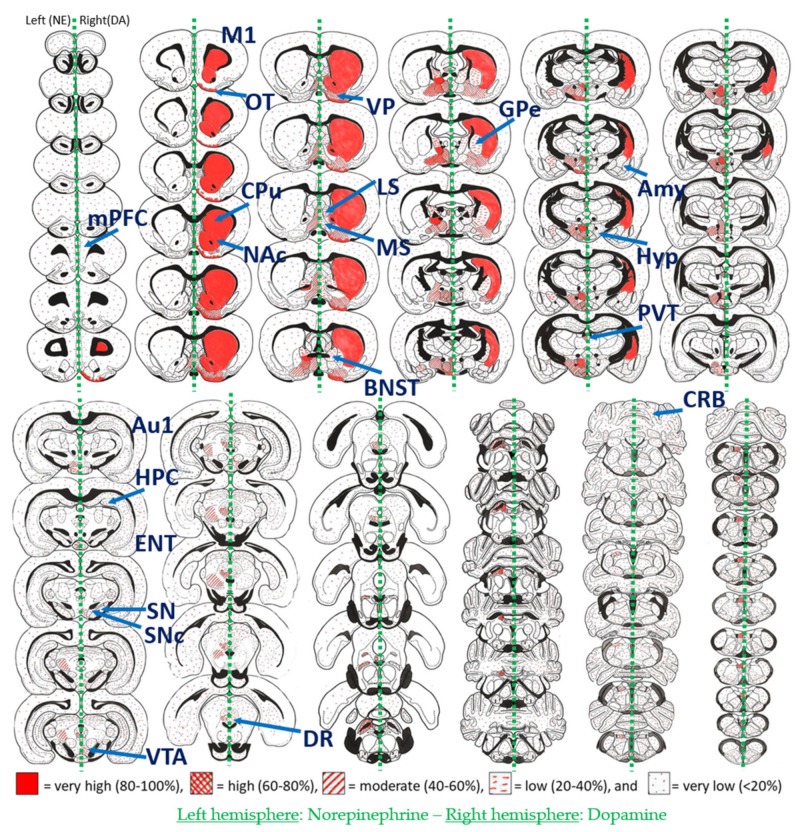
Figure 2.
Distribution of norepinephrine (NE) (left hemispheres) and dopamine (DA) (right hemispheres) neurotransmitter levels as measured by enzyme isotope biochemistry assays in micropunches of the rat brain. The red fill pattern indicates the percentage of NE and DA relative to the highest measured value. NE: very high = greater than 64.0; high = 48.1–64.0; moderate = 32.1–48.1; low = 16.0–32.1; very low= less than 16 ng/mg protein. DA: very high = greater than 83.6; high = 62.7–83.6; moderate = 41.8–62.7, low = 20.9–41.8; very low= less than 20.9 ng/mg protein. Of note, the distribution pattern of DA and NE in the dorsal striatum and NAc is dramatically distinct—with DA content being very high (80–100%), while NE content is very low (less than 20%). Au1: primary auditory cortex; BNST: Bed nucleus of the stria terminalis; CPu: caudate-putamen (= dorsal striatum); CRB: cerebellum; DR: dorsal raphe; ENT: entorhinal cortex; GPe: globus pallidus externus; HPC: hippocampal formation; Hyp: Hypothalamus; LS: lateral septum; M1: primary motor cortex; mPFC: medial prefrontal cortex; MS: medial septum; NAc: Nucleus accumbens; OT: olfactory tubercle; PVT: paraventricular nucleus of the thalamus; SN: substantia nigra; SNc: SN compacta; TeA: temporal association cortex; VP: ventral pallidum; VTA: ventral tegmental area. For detailed brain region annotations see the original image source [130]. This Figure was modified with permission from Björklund & Hökfelt (1984), Handbook of Chemical Neuroanatomy, Vol. 2–Part 1. © Elsevier Science Publishers B.V. (1984), Amsterdam, Netherlands [130].

