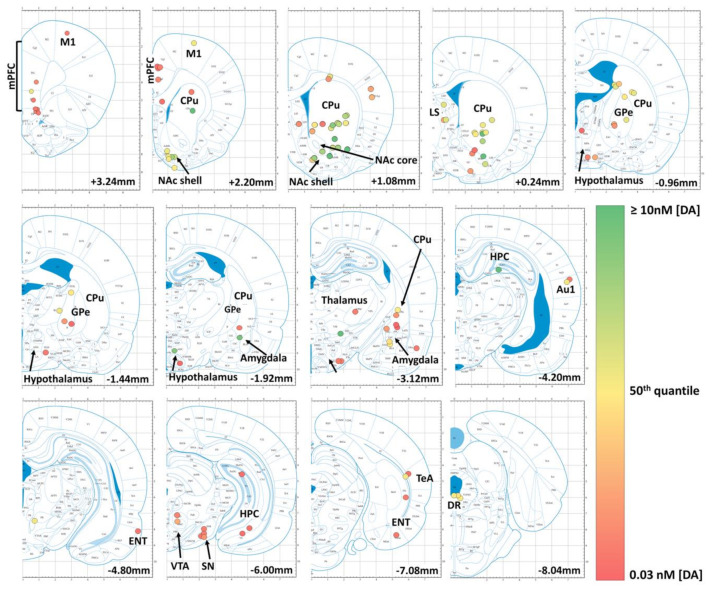
Figure 3.
Graphical representation of previously reported basal dopamine concentrations measured via intracerebral microdialysis experiments performed in rats. Coronal brain sections from AP + 3.24 mm to AP -8.04 mm (relative to bregma) are depicted. The colored circles indicate the reported positions of the microdialysis probes and the fill color of the circles is color-coded to represent the values of the reported basal dopamine concentrations. Of note, the striatal basal dopamine concentrations are amongst the largest in rat brain (brain sections AP + 1.08 mm and AP + 0.24 mm). Importantly, the basal dopamine levels do not represent phasic dopamine release since they are predominantly measured during baseline at rest and are a result of dialysate collection times in the range of several minutes. For detailed information on the previous studies reported in this analysis please consult Supplementary Table S1. This figure was modified with permission from Paxinos & Watson (2005), The rat brain in stereotaxic coordinates, 5th edition. © Elsevier Academic Press (2005), Burlington, MA 01803, USA [213].

