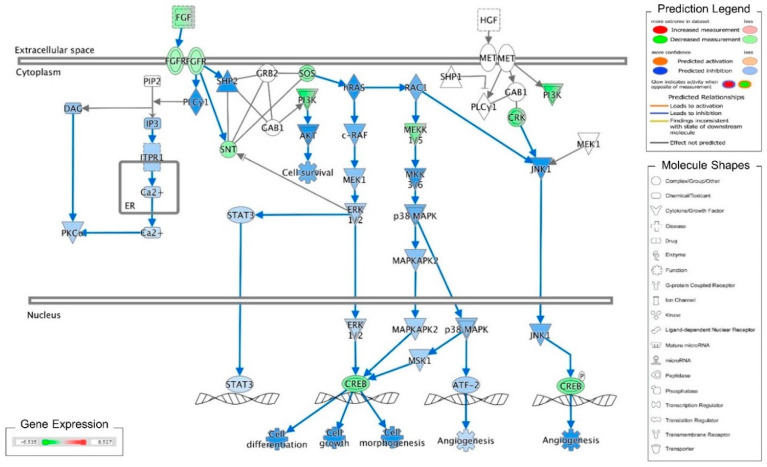
Figure 1.
Ingenuity pathway analysis of FGF/FGFR pathway suppressed by cordycepin in MA-10 cells. Microarray analysis was performed on MA-10 cells treated with either 100 μM cordycepin or a vehicle for 3 h. The genes significantly up- and down-regulated by cordycepin were overlaid onto the canonical signaling pathways by using an Ingenuity Pathways Analysis (IPA) program (IPA, QIAGEN Inc., https://www.qiagenbioinformatics.com/products/ingenuity-pathway-analysis). The genes significantly regulated by cordycepin were mapped onto the canonical FGF signaling pathway. The activation or inhibition effects of the pathways were predicted by the molecule activity predictor (MAP) overlay tools in the IPA program. Red-Green color indicates the level of gene expression. Blue color indicates the inhibitory effect, whereas an orange color indicates an activating effect. Yellow color means that the finding is inconsistent with the state of downstream molecules, and a gray color means no prediction on the path.

