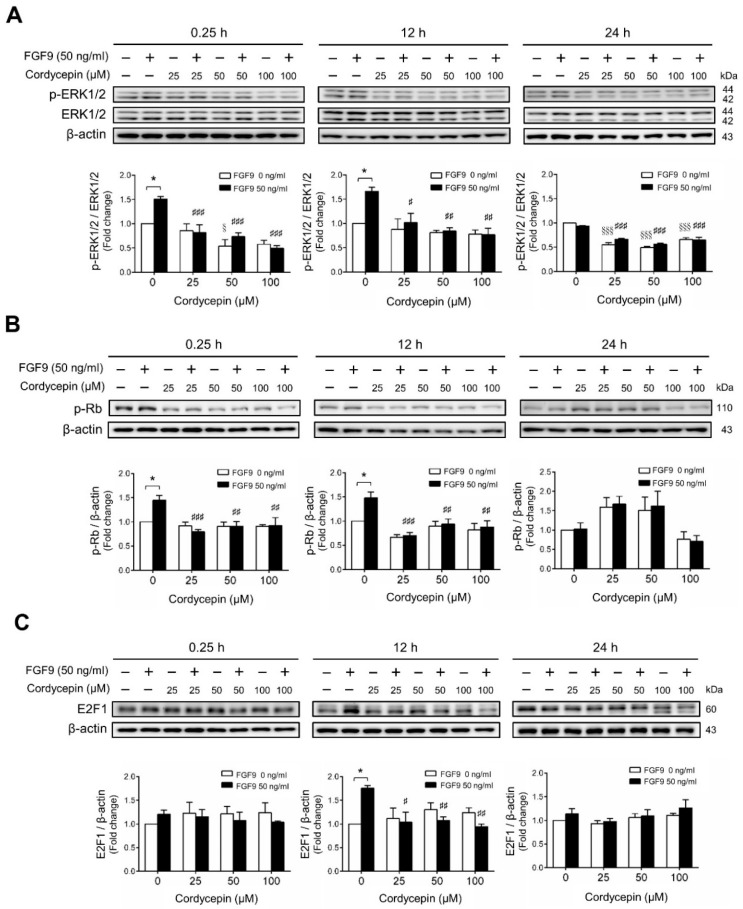
Figure 3.
Cordycepin suppressed FGF9-induced expression of p-ERK1/2, p-Rb and E2F1 in MA-10 cells. Western blot analysis for the expression of (A) total ERK1/2, p-ERK1/2 (Thr202/Tyr204), (B) p-Rb and (C) E2F1 in MA-10 cells treated without or with FGF9 (50 ng/mL) and different concentrations of cordycepin (0, 25, 50 and 100 µM) for 0.25, 12 and 24 h, respectively. Quantitative analysis of Western blotting using ImageJ software. Values are shown as the mean ± SEM, n = 4. p values were calculated using two-way ANOVA with Tukey’s multiple comparisons post-tests. * p < 0.05 compared to the control group (0 ng/mL FGF9) at each dose of cordycepin; §§§ p < 0.001 compared to the group with 0 μM cordycepin and 0 ng/mL FGF9 treatments; # p < 0.05, ## p < 0.01, ### p < 0.001 compared to the group with 0 μM cordycepin and 50 ng/mL FGF9 treatments.

