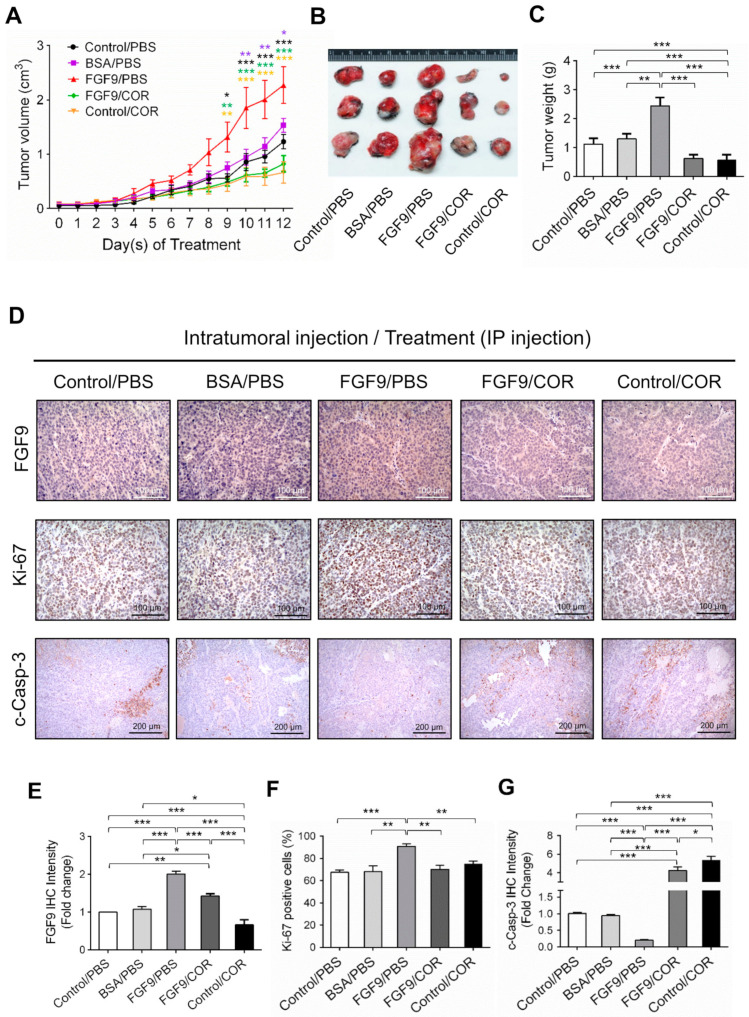
Figure 7.
Cordycepin suppressed in vivo tumor growth in the C57BL/6J mouse model of FGF9-induced testicular tumorigenesis. Seven days after MA-10 cell inoculation, mice were randomly allocated to five groups (i.t./i.p.): Control/PBS, BSA/PBS, FGF9/PBS, FGF9/COR and Control/COR groups. In the control group, mice were inoculated with MA-10 cells and received no i.t. injection. (A) Tumor growth curves of the MA-10 tumor-bearing mice received different treatments, as indicated in the plots. (B) Photograph of excised MA-10 tumors and (C) tumor weights at the time mice were sacrificed. (D) The immunohistochemical (IHC) assay of the expression of FGF9, Ki-67 and cleaved caspase-3 (c-Casp-3) on MA-10 tumor tissue from Control/PBS, BSA/PBS, FGF9/PBS, FGF9/COR and Control/COR-treated mice (original magnification: FGF9 and Ki-67, x200; C-Casp-3, x100). (E–G) IHC quantification of the expression of (E) FGF9, (F) Ki-67 and (G) c-Casp-3 in MA-10 tumor tissue from (D). Quantification values are represented as the mean ± SEM, n = 5. p values were calculated using two-way ANOVA with Sidak’s multiple comparisons post-tests (A), *p < 0.05, ** p < 0.01, *** p < 0.001 with different color indicates a statistically significant difference at each time point compared to their corresponding control group; and one-way ANOVA with Tukey’s multiple comparisons post-tests (C,E–G), * p < 0.05, ** p < 0.01, *** p < 0.001. COR: cordycepin.

