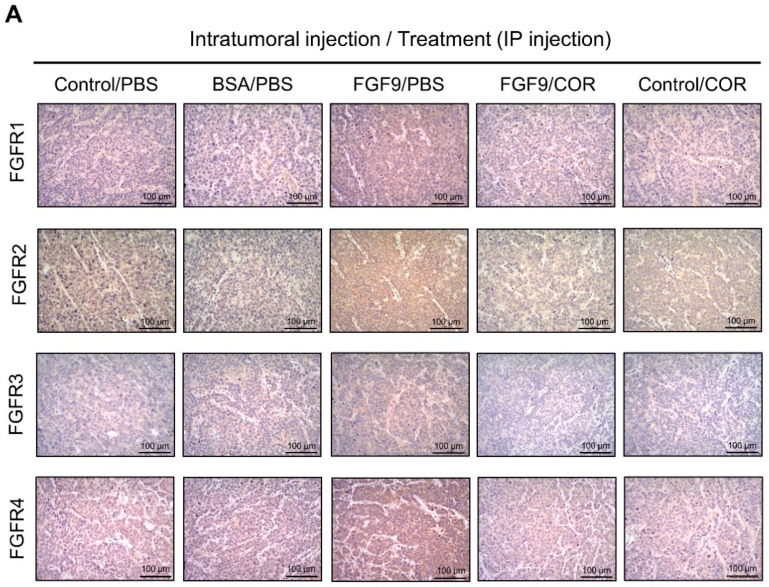
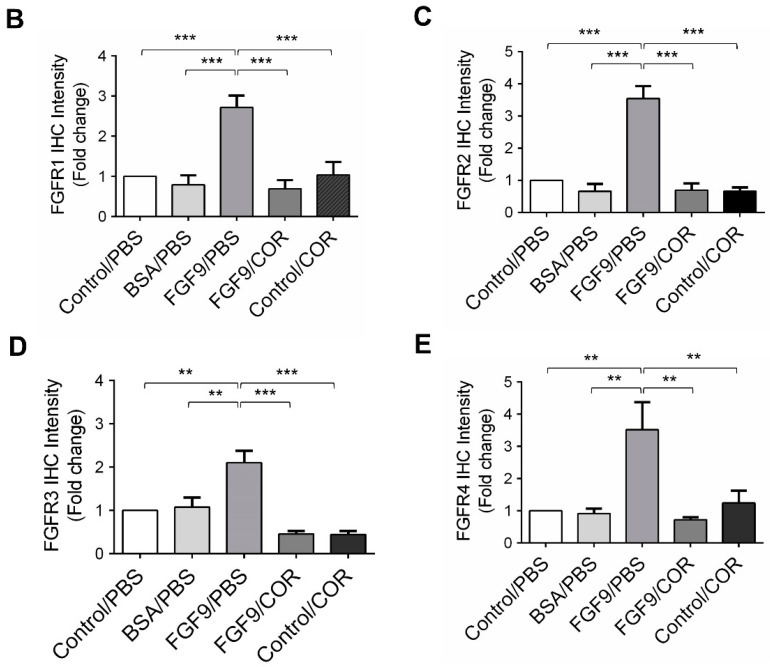
Figure 9.
Cordycepin reduced the expression of FGFR1-4 in FGF9-induced allograft model. (A) The immunohistochemical (IHC) assay of the expression patterns of FGFR1, FGFR2, FGFR3 and FGFR4 in MA-10 tumor tissues from Control/PBS, BSA/PBS, FGF9/PBS, FGF9/COR and Control/COR treated mice (original magnification 200×). (B–E) IHC quantification of the expression of (B) FGFR1, (C) FGFR2, (D) FGFR3 and (E) FGFR4 in MA-10 tumor tissue from (A). Quantification values are represented as the mean ± SEM, n = 5. p values were calculated using one-way ANOVA with Tukey’s multiple comparisons post-tests, ** p < 0.01, *** p < 0.001. COR: cordycepin.


