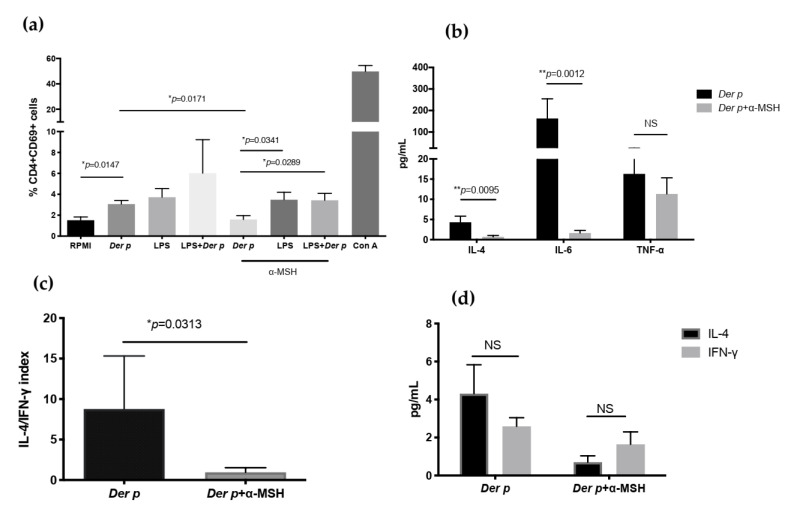
Figure 4.
Expression of CD69 in CD4+T cells and decreases in IL-4 and IL-6 after Der p stimulation. (a) CD69 expression in CD4+T cells after 72 h of culturing with Der p, LPS, and α-MSH; (b) IL-4, IL-6, and TNF-α in supernatant after 72 h of culturing with Der p, LPS, and α-MSH; (c) IL-4/IFN-γ index; (d) IL-4 and IFN-γ comparison after culturing with Der p and α-MSH. * p ≤ 0.05; ** p ≤ 0.01; NS p ≥ 0.05.

