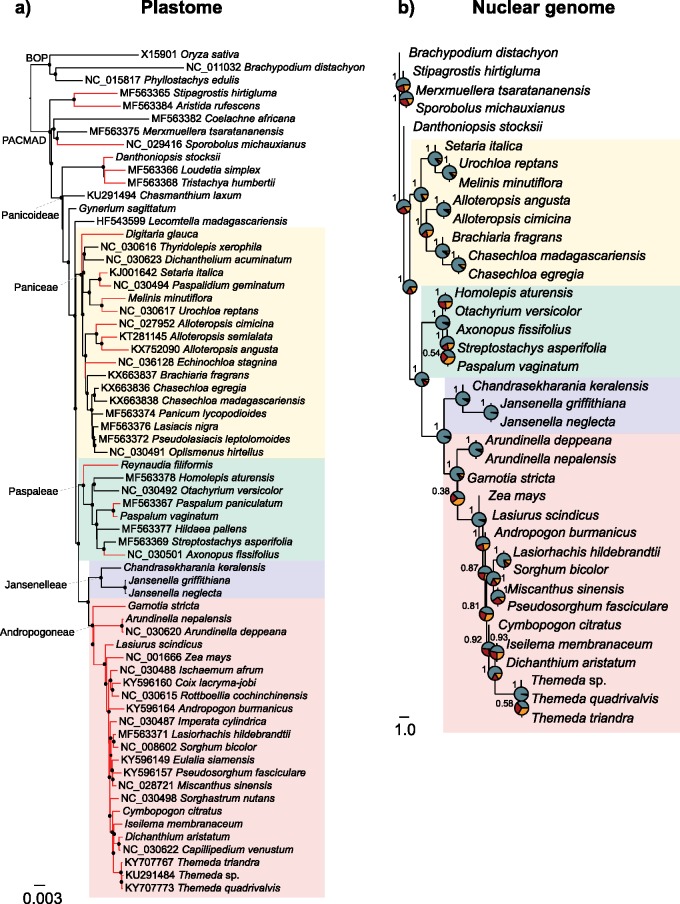
Figure 1.
Phylogenetic trees of grasses based on (a) plastomes and (b) genome-wide nuclear data. a) Bayesian phylogram inferred from coding sequences of plastomes (see Supplementary Fig. S2 available on Dryad for phylogram based on non-coding sequences). Branch lengths are in expected substitutions per site. Closed circles on nodes indicate Bayesian posterior probability  . Branches in red lead to C
 species. b) Multigene coalescent species tree estimated from 365 nuclear genes. Pie charts on nodes indicate the proportion of quartet trees that support the main topology (in blue), the first alternative (in red), and the second alternative (in orange). Local posterior probabilities are indicated near nodes. Branch lengths are in coalescent units. The major groups of Panicoideae are delimited with shades.

