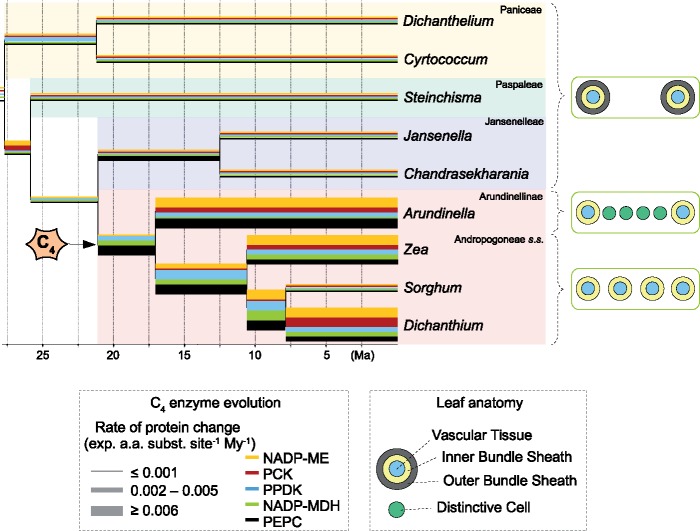
Figure 4.
C -related changes in protein sequences and leaf anatomy in the Andropogoneae grasses. A time-calibrated phylogenetic tree of Panicoideae is presented, with selected C
 species outside Andropogoneae (see Supplementary Fig. S5 available on Dryad for full phylogenetic tree). Branch thickness is proportional to the rate of protein change and colors represent different C
 enzymes. A simplified transverse section of the leaf is presented on the right, with colors representing the different tissues.

