
Figure 14.
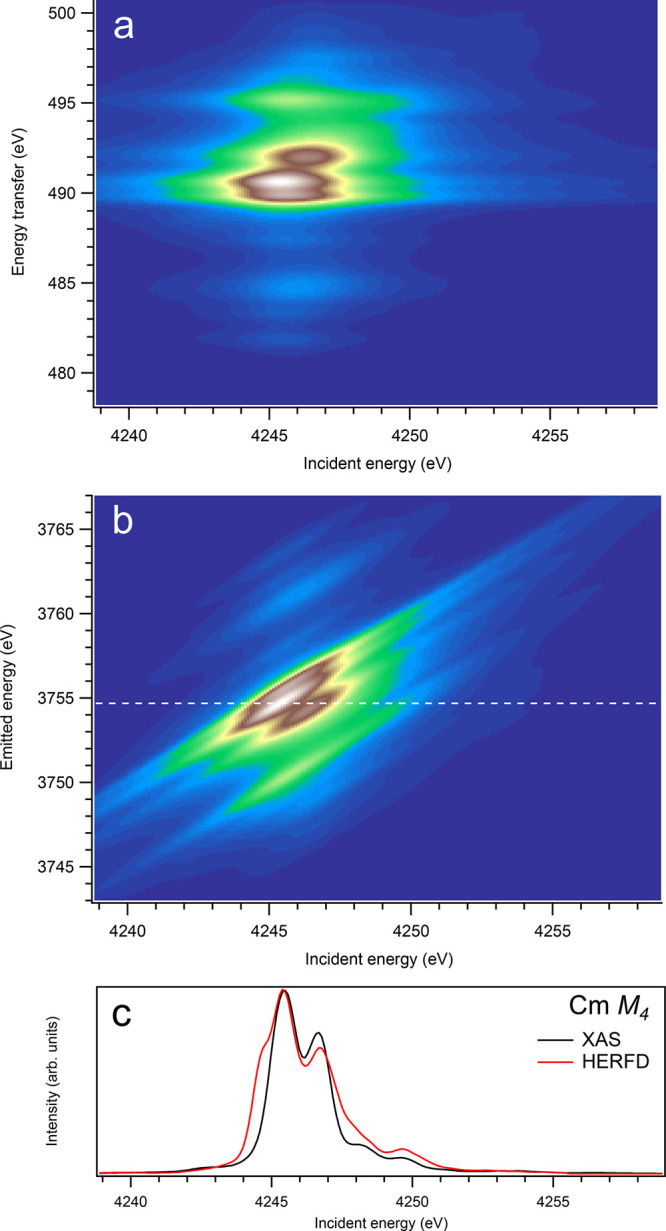
3d-to-4f RIXS map of CmO2 with the incident energy on the x-axis and the (a) energy transfer or (b) emitted energy on the y-axis. The incident energy varies across the Cm M4 edge. (c) Comparison between the calculated conventional XAS spectrum (black curve) at the Cm M4 edge with a reduced core–hole lifetime broadening and a HERFD cut (red curve) of the 3d-to-4f RIXS map along the incidence energy axis at an emitted energy corresponding to the RIXS maximum. This cut is indicated by a dashed line in panel (b). The spectra in panel (c) are normalized to a main maximum.