
Figure 3:
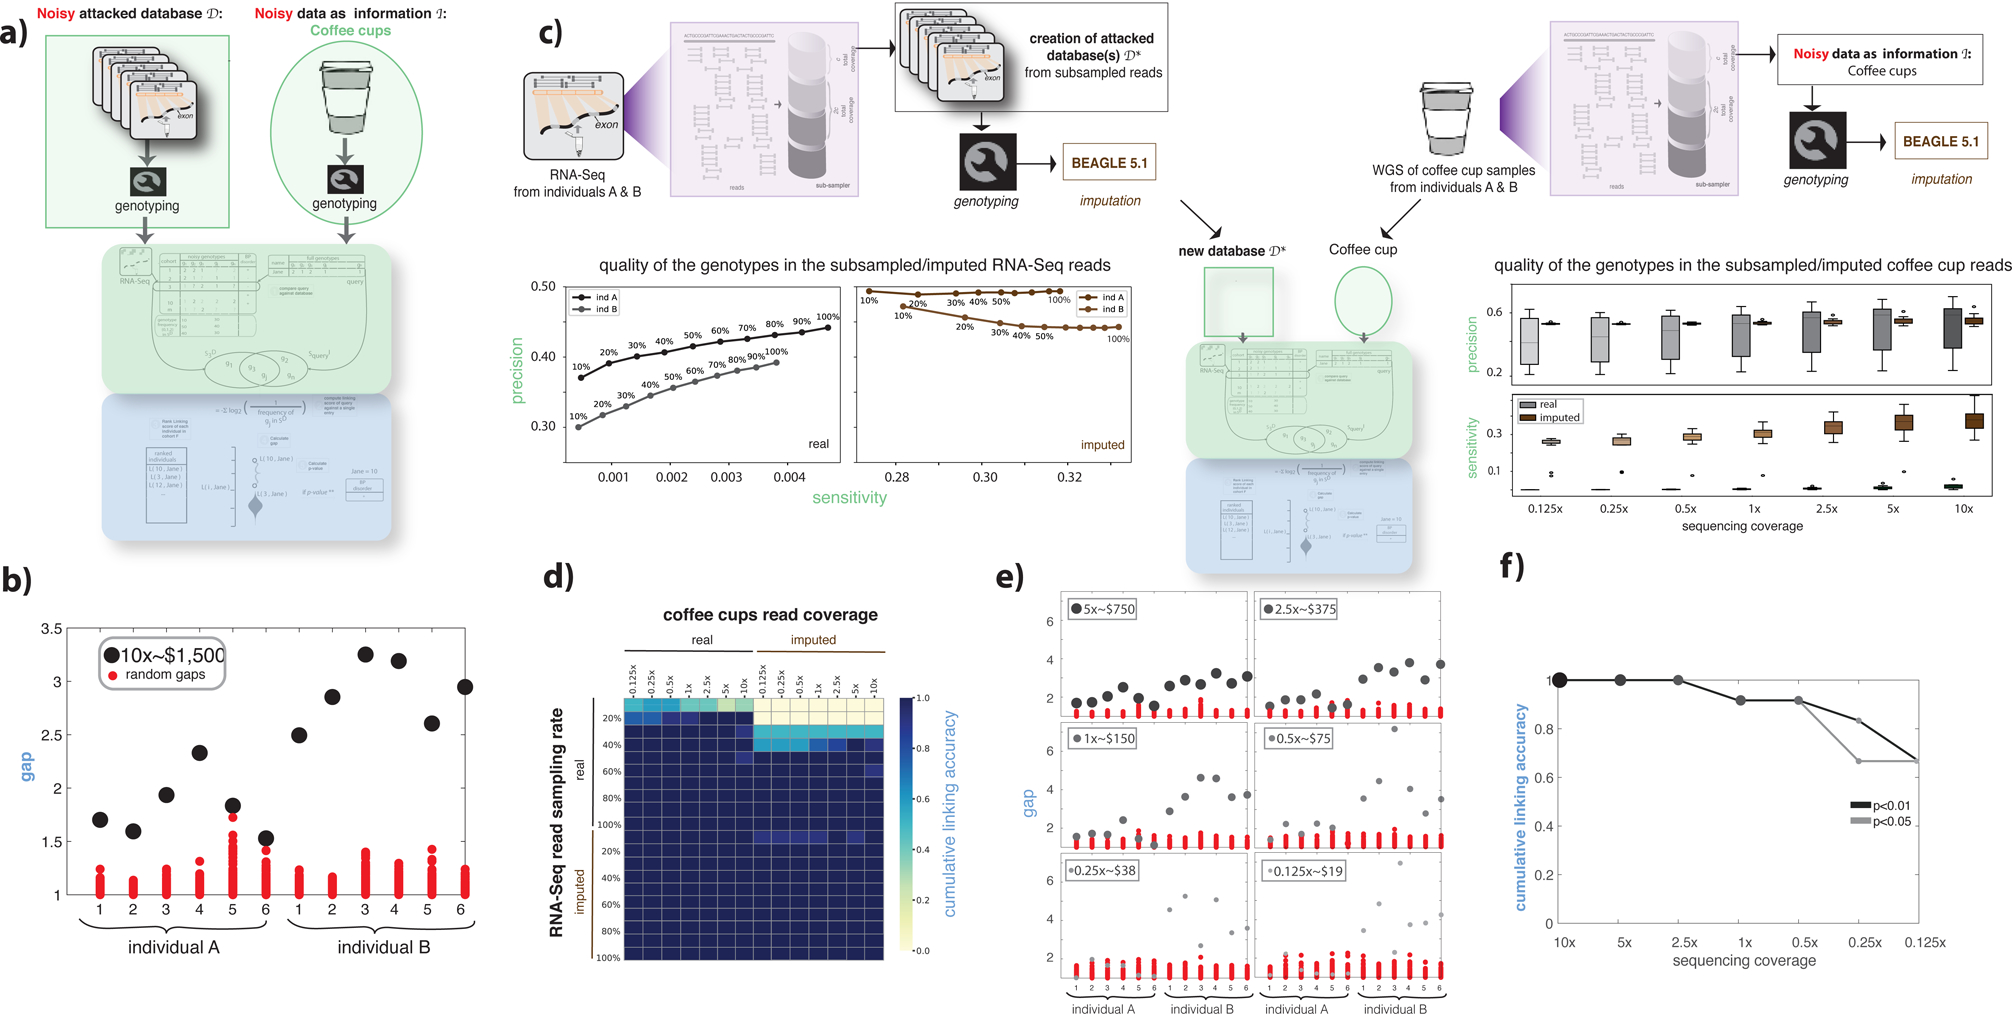
Functional genomics data de-anonymization scheme with noisy genomes. (a) Anonymized functional genomics data from a cohort of individuals can be seen as a database to be attacked. The noisy information can be assumed to be DNA surreptitiously gathered from a known individual’s used coffee cup. The procedure described in Figure 1a was repeated. See also Figure S1. (b) gap values for two individuals and six coffee cups, each at 10x sequencing coverage. (c) The process of generating different databases and noisy information by (i) subsampling the reads from functional genomics data and the coffee cup sequences and (ii) imputing the genotypes obtained from functional genomics data and the coffee-cup sequences at different subsampling rates. The precision and sensitivity of the called genotypes are shown for each subsampling/imputation level. A total of 2,880 linkage attacks were performed using each subsampled database with and without imputation and using each subsampled coffee-cup reads with and without imputation. (d) Linking accuracy was calculated for each of the 2,880 linking attacks and depicted as a heatmap. (e) gap values for 2 individuals and 12 coffee cups, each at different sequencing coverage, compared with gap values obtained using random sets of genotypes. The RNA-Seq data used in this plot corresponds to a 20% sampling rate (second row in panel d). (f) Cumulative linking accuracy after subsampling the sequencing coverage calculated using the information in panel e.