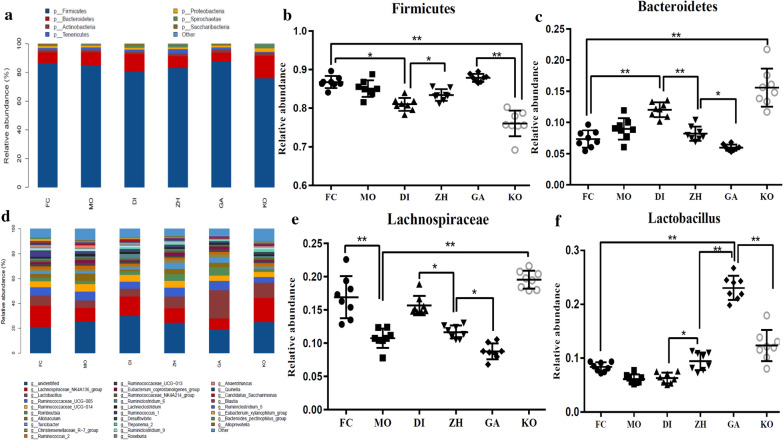
Fig. 2.
Composition of the gut microbiota: a the relative contribution of the top 8 phyla in each group; b relative abundance of Firmicutes in six groups, the data were analyzed by one-way ANOVA (*p < 0.05; **p < 0.01); c Relative abundance of Bacteroides in six groups, the data were analyzed by one-way ANOVA (*p < 0.05; **p < 0.01); d the relative contribution of the top 30 genera in each group; e relative abundance of Lachnospiraceae in six groups, the data were analyzed by one-way ANOVA (*p < 0.05; **p < 0.01); f relative abundance of Lactobacillus in six groups, the data were analyzed by one-way ANOVA (*p < 0.05; **p < 0.01)

