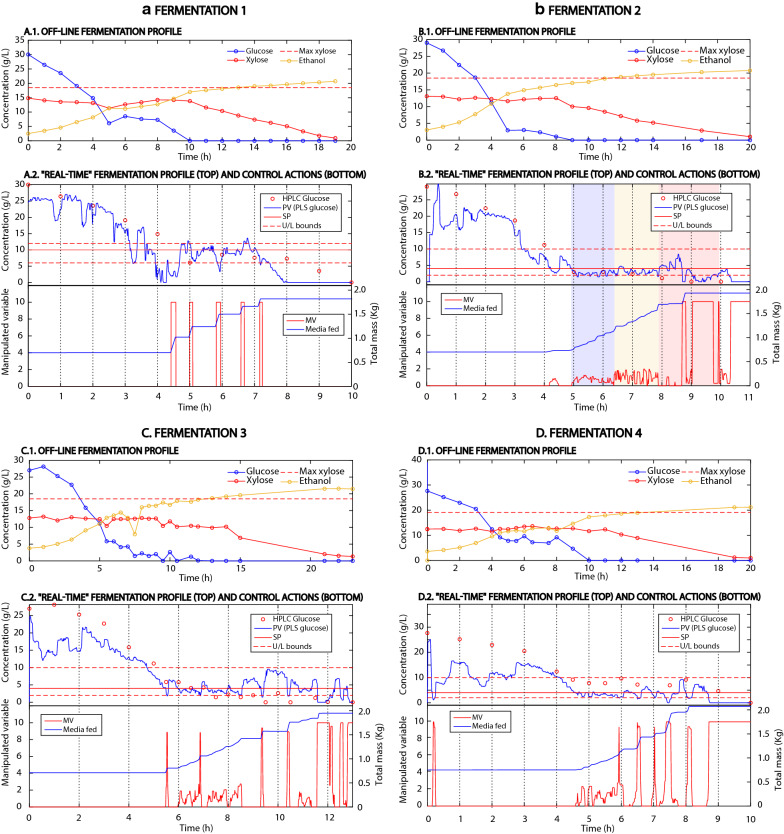
Fig. 2.
Experimental results of fed-batch fermentations 1–4. A.1–D-1 show the fermentation profiles of experiments 1–4. Note that initially, the 750 mL of biomass hydrolysate were mixed with 250 mL of inoculum, diluting the initial concentration of glucose and xylose. The dashed red line (Max xylose) shows the maximum xylose concentration accumulated in the reactor if there was no co-consumption of glucose and xylose. A.2–D-2 (top) show the PV (process variable) predicted by the PLS (partial least squares) model, the set-point (SP) for the fermentation, the upper and lower bounds, and the off-line samples analysed with high-performance liquid chromatography (HPLC). In fermentation 2 (B.2), the three different configurations of the PID that were tested are shown with blue, yellow, and red backgrounds. Note that before the first controller strategy was implemented in fermentation 2 (blue-shaded area) the same controller configuration as in fermentation 1 was used. A.2–D-2 (bottom) show the manipulated variable (MV), a signal scaled from 0–10 sent to the controlled pump, and the mass of wheat straw hydrolysate fed into the reactor

