Fig. 3.
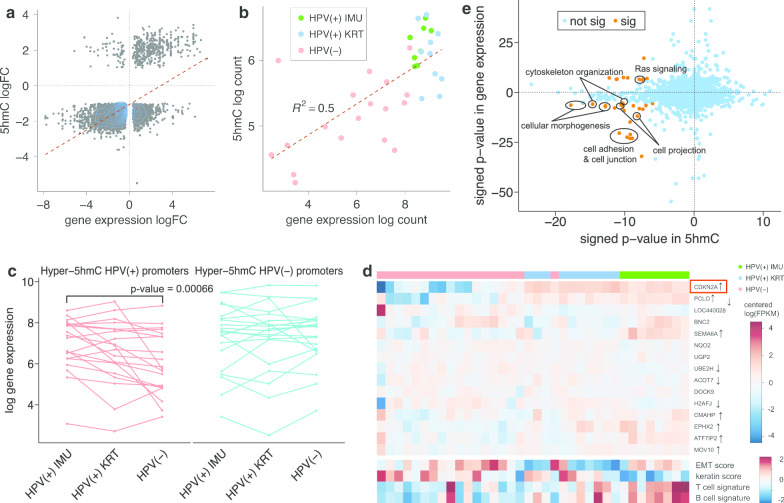
5hmC in HNSCC is highly correlated with gene expression. a Scatterplot showing the positive correlation between gene expression and hydroxymethylation in HPV(+) and HPV(−) samples (Pearson correlation coefficient = 0.62). The top half represents genes that are significantly up-regulated in HPV(+) tumors, and the right half represents genes that are significantly hyper-hydroxymethylated in HPV(+) tumors. b Scatterplot showing a strong correlation between log gene expression and log 5hmC of 5 kb intron region (chr9:21975000–21980000) of CDKN2A. HPV(+) samples were concentrated near the top right corner, indicating that both their gene expression and 5hmC coverage were higher compared with HPV(−) samples. c Spaghetti plot of log gene expression for top 20 genes with at least one DhMR in their promoter region for HPV(+) IMU, HPV(+) KRT and HPV(−) samples, respectively. d Heatmap showing the expression levels of sufficiently expressed genes with at least one HPV(+) DhMR in their promoter, which were mostly well clustered based on HPV status (marked with black and grey at the top). Most genes were significantly higher expressed in HPV(+) samples, such as CDKN2A. ↑ indicates genes that are also up-regulated in HPV(+) HNSCC, and ↓ indicates up-regulation in HPV(−) tumors. Keratin and EMT scores are measurements of keratinization level and EMT level, and T cell signature and B cell signature represent degree of immune response. Generally there was a higher level of keratinization and EMT in HPV(−) samples, while the immune response is more significant in HPV(+) samples. The detailed calculation can be found in Zhang et al. [9]. e Enrichment analysis results for gene expression vs hydroxymethylation by HPV status. Each dot represents one GO term, and the color denotes the significance (yellow: significant; blue: not significant). Signed p values are defined as > 0 to indicate up-regulation in HPV(+) samples or hyper-hydroxymethylation in HPV(+) samples, and < 0 to indicate upregulation in HPV(−) samples or hyper-hydroxymethylation in HPV(−) samples

