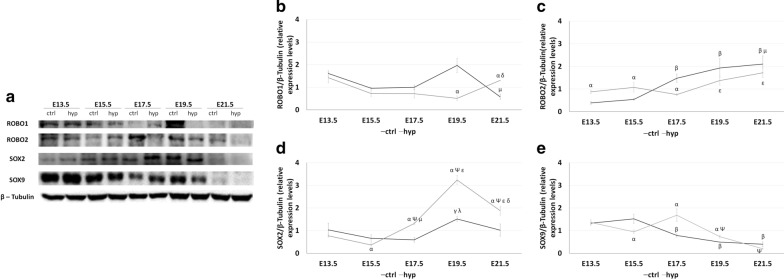
Fig. 1.
Distinct expression profiles for receptors and epithelial progenitors in normal and hypoplastic lungs. a Examples of representative blots are shown for each protein analyzed. Western blot analysis of b ROBO1; c ROBO2; d SOX2; and e SOX9 relative expression levels in normal (ctrl) and hypoplastic (hyp) lungs at selected gestational ages from E13.5-to-E21.5. Each lane represents a pooled-tissue sample, and relative expression was determined against β-Tubulin. Semi-quantitative analysis of three independent experiments for each protein is plotted (n ≥ 9 per timepoint and experimental groups, respectively). Results are presented as mean ± SEM. Symbols indicate the main effects and non-redundant interactions of the two-way ANOVA. p < 0.05: αvs. ctrl; βvs. E13.5- and 15.5-ctrl; Ψvs E13.5- and E15.5-hyp; γvs E15.5-ctrl; µvs E15.5-hyp; λvs E17.5-ctrl; εvs E17.5-hyp; δvs E19.5-hyp

