Fig. 5.
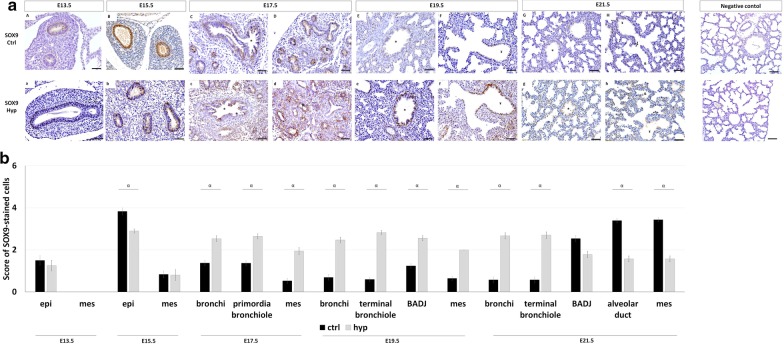
SOX9 spatiotemporal distribution in normal and hypoplastic lungs. a Representative immunohistochemical evidence SOX9 expression along the normal (ctrl, aA–aH); and hypoplastic (hyp, aa–ah) fetal lung development, from E13.5-to-E21.5. Symbols in each figure identify the distinct pulmonary structures: *bronchi; ¤primordia of bronchiole; ¥terminal bronchiole; {bronchioalveolar duct junction; &alveolar duct. Data is representative of n ≥ 3 independent experiments per stage/protein. b SOX9 stained cells quantified by pulmonary structure and developmental stage. Results are presented as mean ± SEM. Symbols indicate the main effects and non-redundant interactions of one-way ANOVA. αp < 0.05. Scale bar 50 µm

