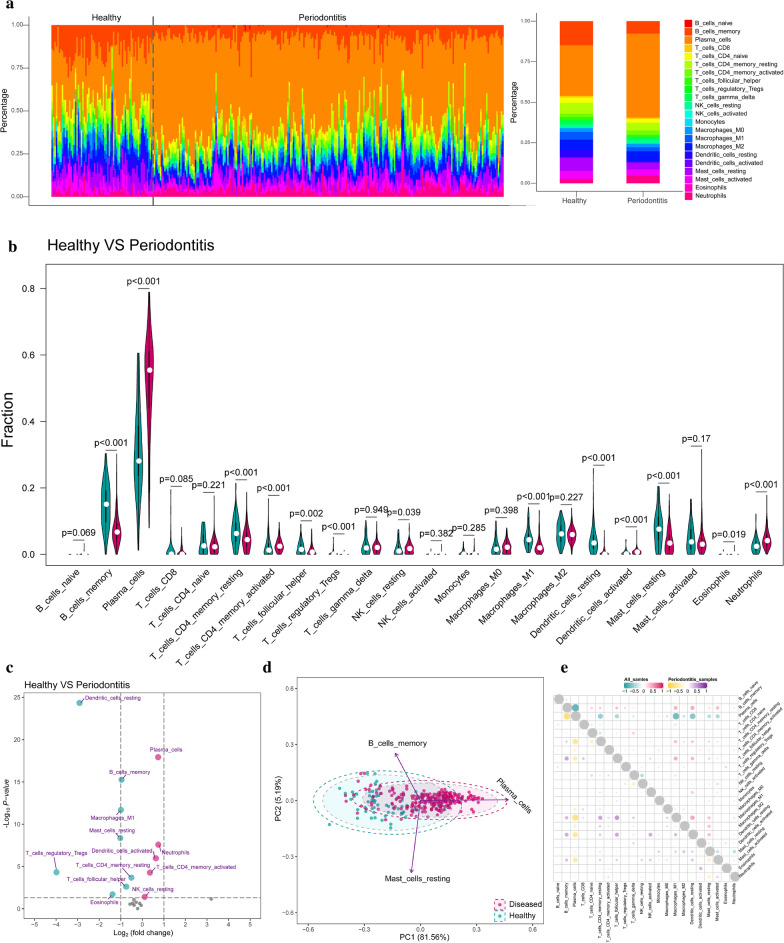
Fig. 1.
Infiltrating immunocytes differences between healthy and periodontitis samples. a The relative fraction of immunocytes identified by the CIBERSORT algorithm, which estimates relative subsets of 22 types of immunocyte from known RNA transcripts. The relative distributions of these 22 immunocytes were presented by bar-plots concerning different disease status (all samples for the left and average for the right). b Compositional differences of 22 immunocytes between healthy and periodontitis presented by violin-plot (blue means healthy and red means periodontitis). c The volcano-plot demonstrates the fold changes of 22 immunocytes in periodontitis compared with healthy. d Principal component analysis (PCA) of 22 infiltrating immunocytes between healthy and periodontitis. The two first principal components (PC1, PC2) which explain the most of the variables are plotted. e Correlation matrix of 22 immunocytes proportions. The top right is correlations of 22 immunocytes in all samples and the left bottom is correlations of 22 immunocytes in periodontitis samples

