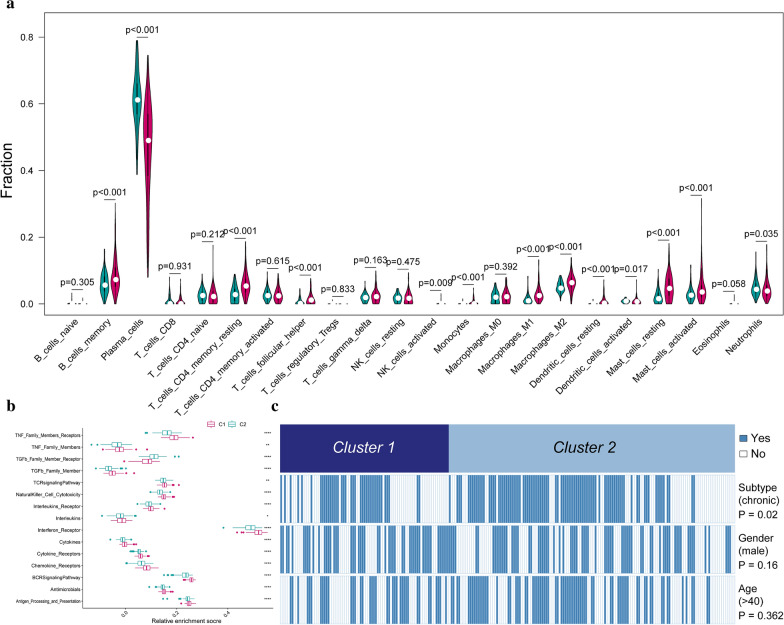
Fig. 5.
Correlations between immune subtypes and immunocytes. a Compositional differences of 22 immunocytes between immune subtype cluster 1 and cluster 2 which was presented by violin-plot (blue means cluster-1 and red means cluster-2). b Comparison of immune-related pathways’ activity between the two immune subtypes. c Comparing periodontitis subtypes, genders, and ages between immune subtype cluster 1 and cluster 2. The heatmap illustrates the association of different clinical characters with cluster 1 and cluster 2 patients. Statistical significance was performed by the χ2 test

