Fig. 7.
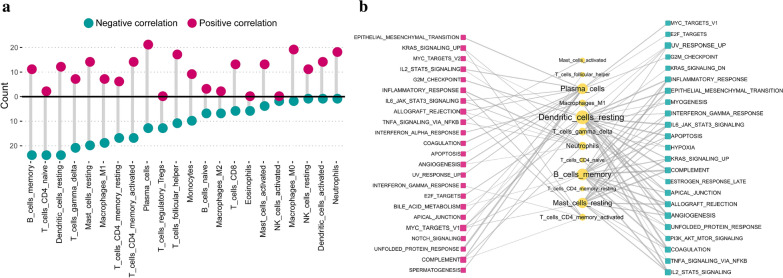
Correlations between 22 immunocytes fractions and activity of 50 important biological hallmark-related pathways. a The number of significant pathways is correlated with individual immunocyte. The upper panel is for positively correlated pathways, and the bottom panel is for negatively correlated pathways. b Network diagram demonstrating the correlation between immunocytes and pathways. Red represents a positive correlation, and blue represents a negative correlation. The size of the nodes corresponds to the number of links, and the thickness of the line represents the correlation coefficient

