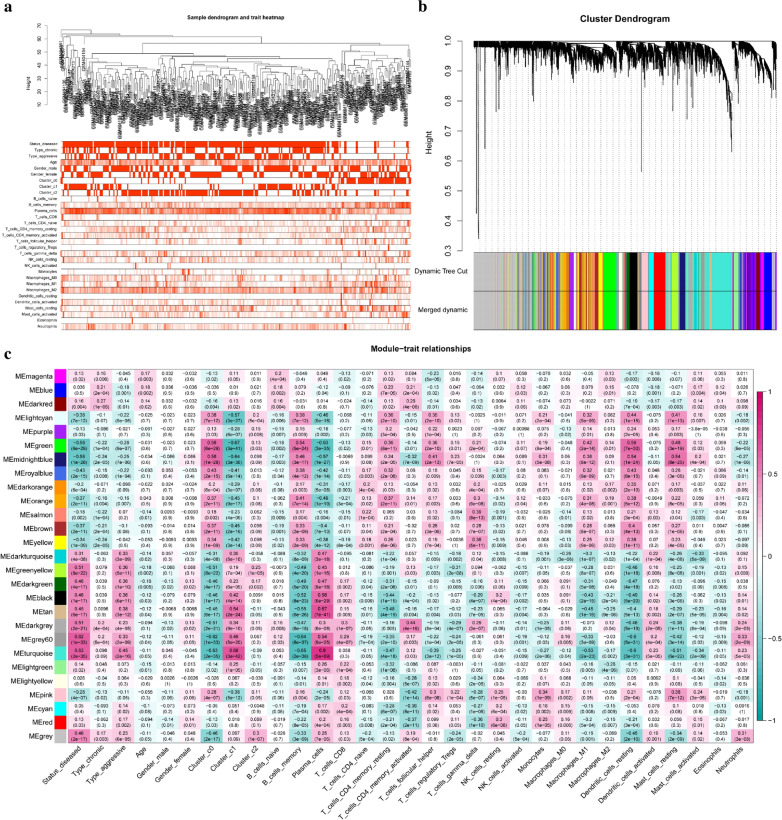
Fig. 8.
Identification of immunocytes and clinical characteristics related to gene modules. a The sample clustering was based on the expression data of all samples. The top 25% of variation genes were used for the analysis by WGCNA and outlier samples were excluded. b Gene dendrogram obtained by average linkage hierarchical clustering. The color row underneath the dendrogram shows the module assignment determined by the Dynamic Tree Cut, in which 27 modules were identified. c Heatmap of the correlation between module eigengenes and the immunocyte fractions

