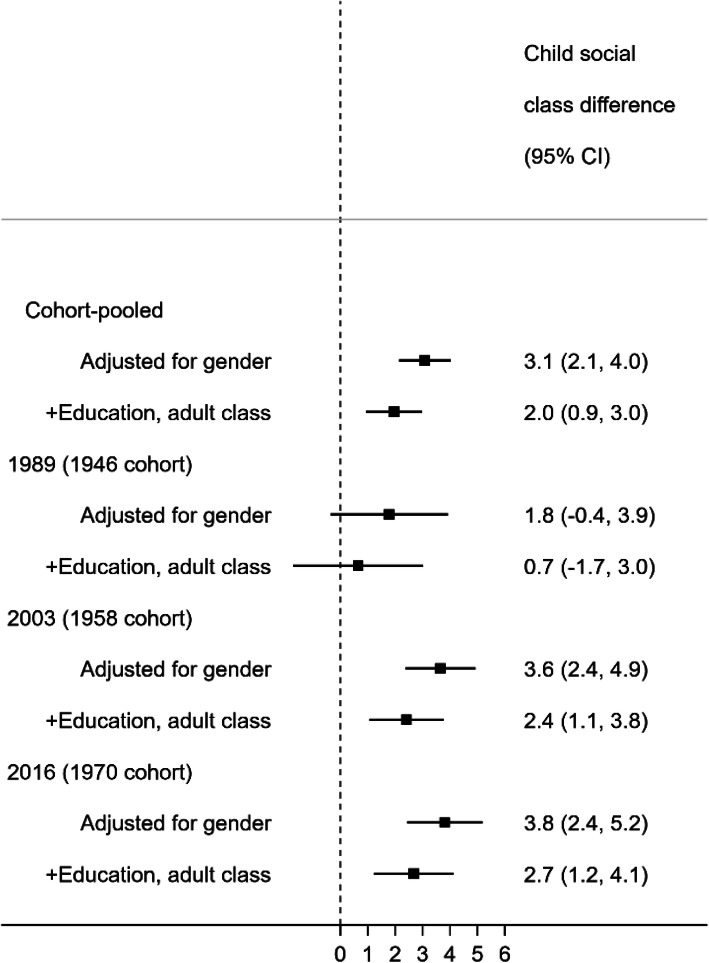
Fig. 2.
Socioeconomic position in early life and mean difference in systolic blood pressure (mmHg) in midlife (43–46 years, from birth cohort data). Estimates are the Slope Index of Inequality (absolute difference in mean SBP levels between the lowest and highest socioeconomic position). An SII of zero (vertical line) indicates equity in BP levels. Underlying SBP levels obtained by adding a constant of 10 mmHg to those using antihypertensive medication. Estimates adjusted for own education and adult social class indicate potential cumulative associations over the life course

