Figure 4.
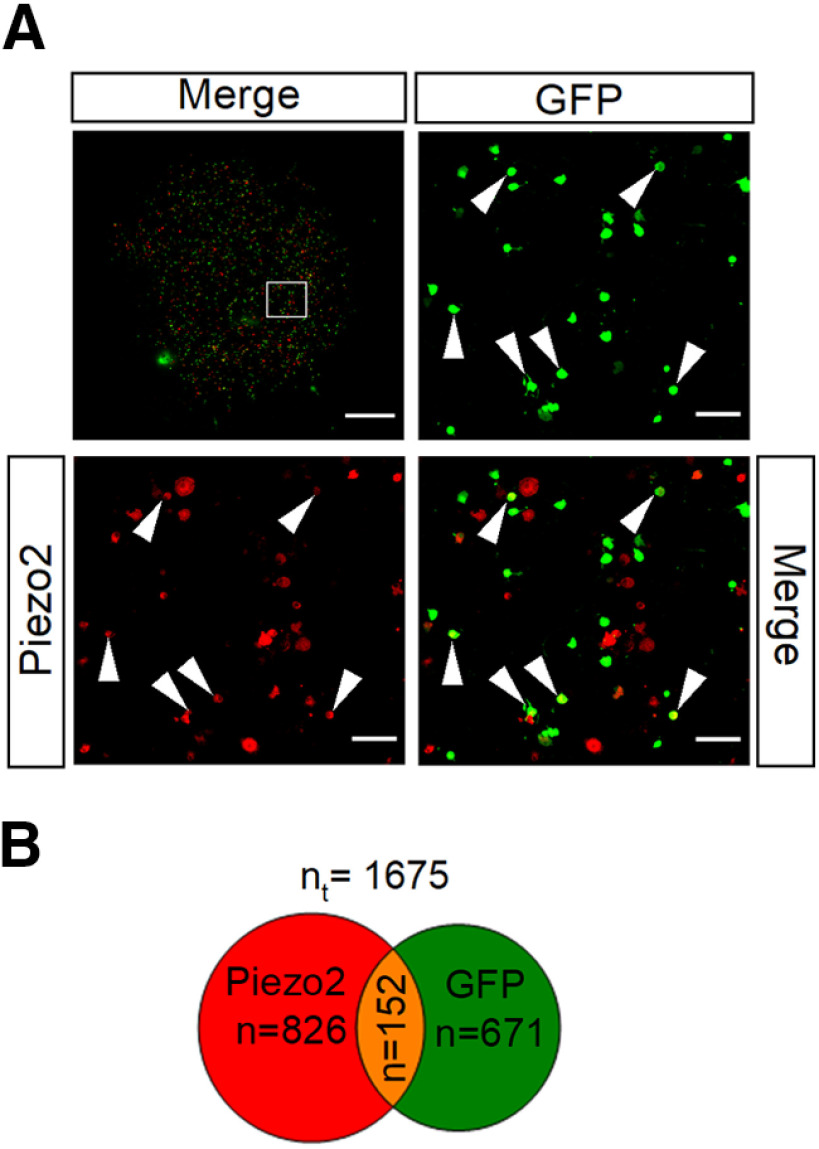
Piezo2 and TRPV1 are coexpressed in a small fraction of TG neurons. A, Immunostaining of TG cultured neurons from TRPV1-EGFP mice with anti-GFP (green) and anti-Piezo2 (red). Top left, A composite image assembled from multiple high-resolution images of an entire coverslip. The boxed region is magnified in the right and bottom images. Arrowheads indicate examples of GFP+/Piezo2+ neurons. Scale bars: entire coverslip image, 1 mm; magnified views, 100 µm. B, Venn diagram showing the quantification of TG neurons that express Piezo2, TRPV1, and overlap between both populations [total number (nt) of neurons analyzed = 1675].

