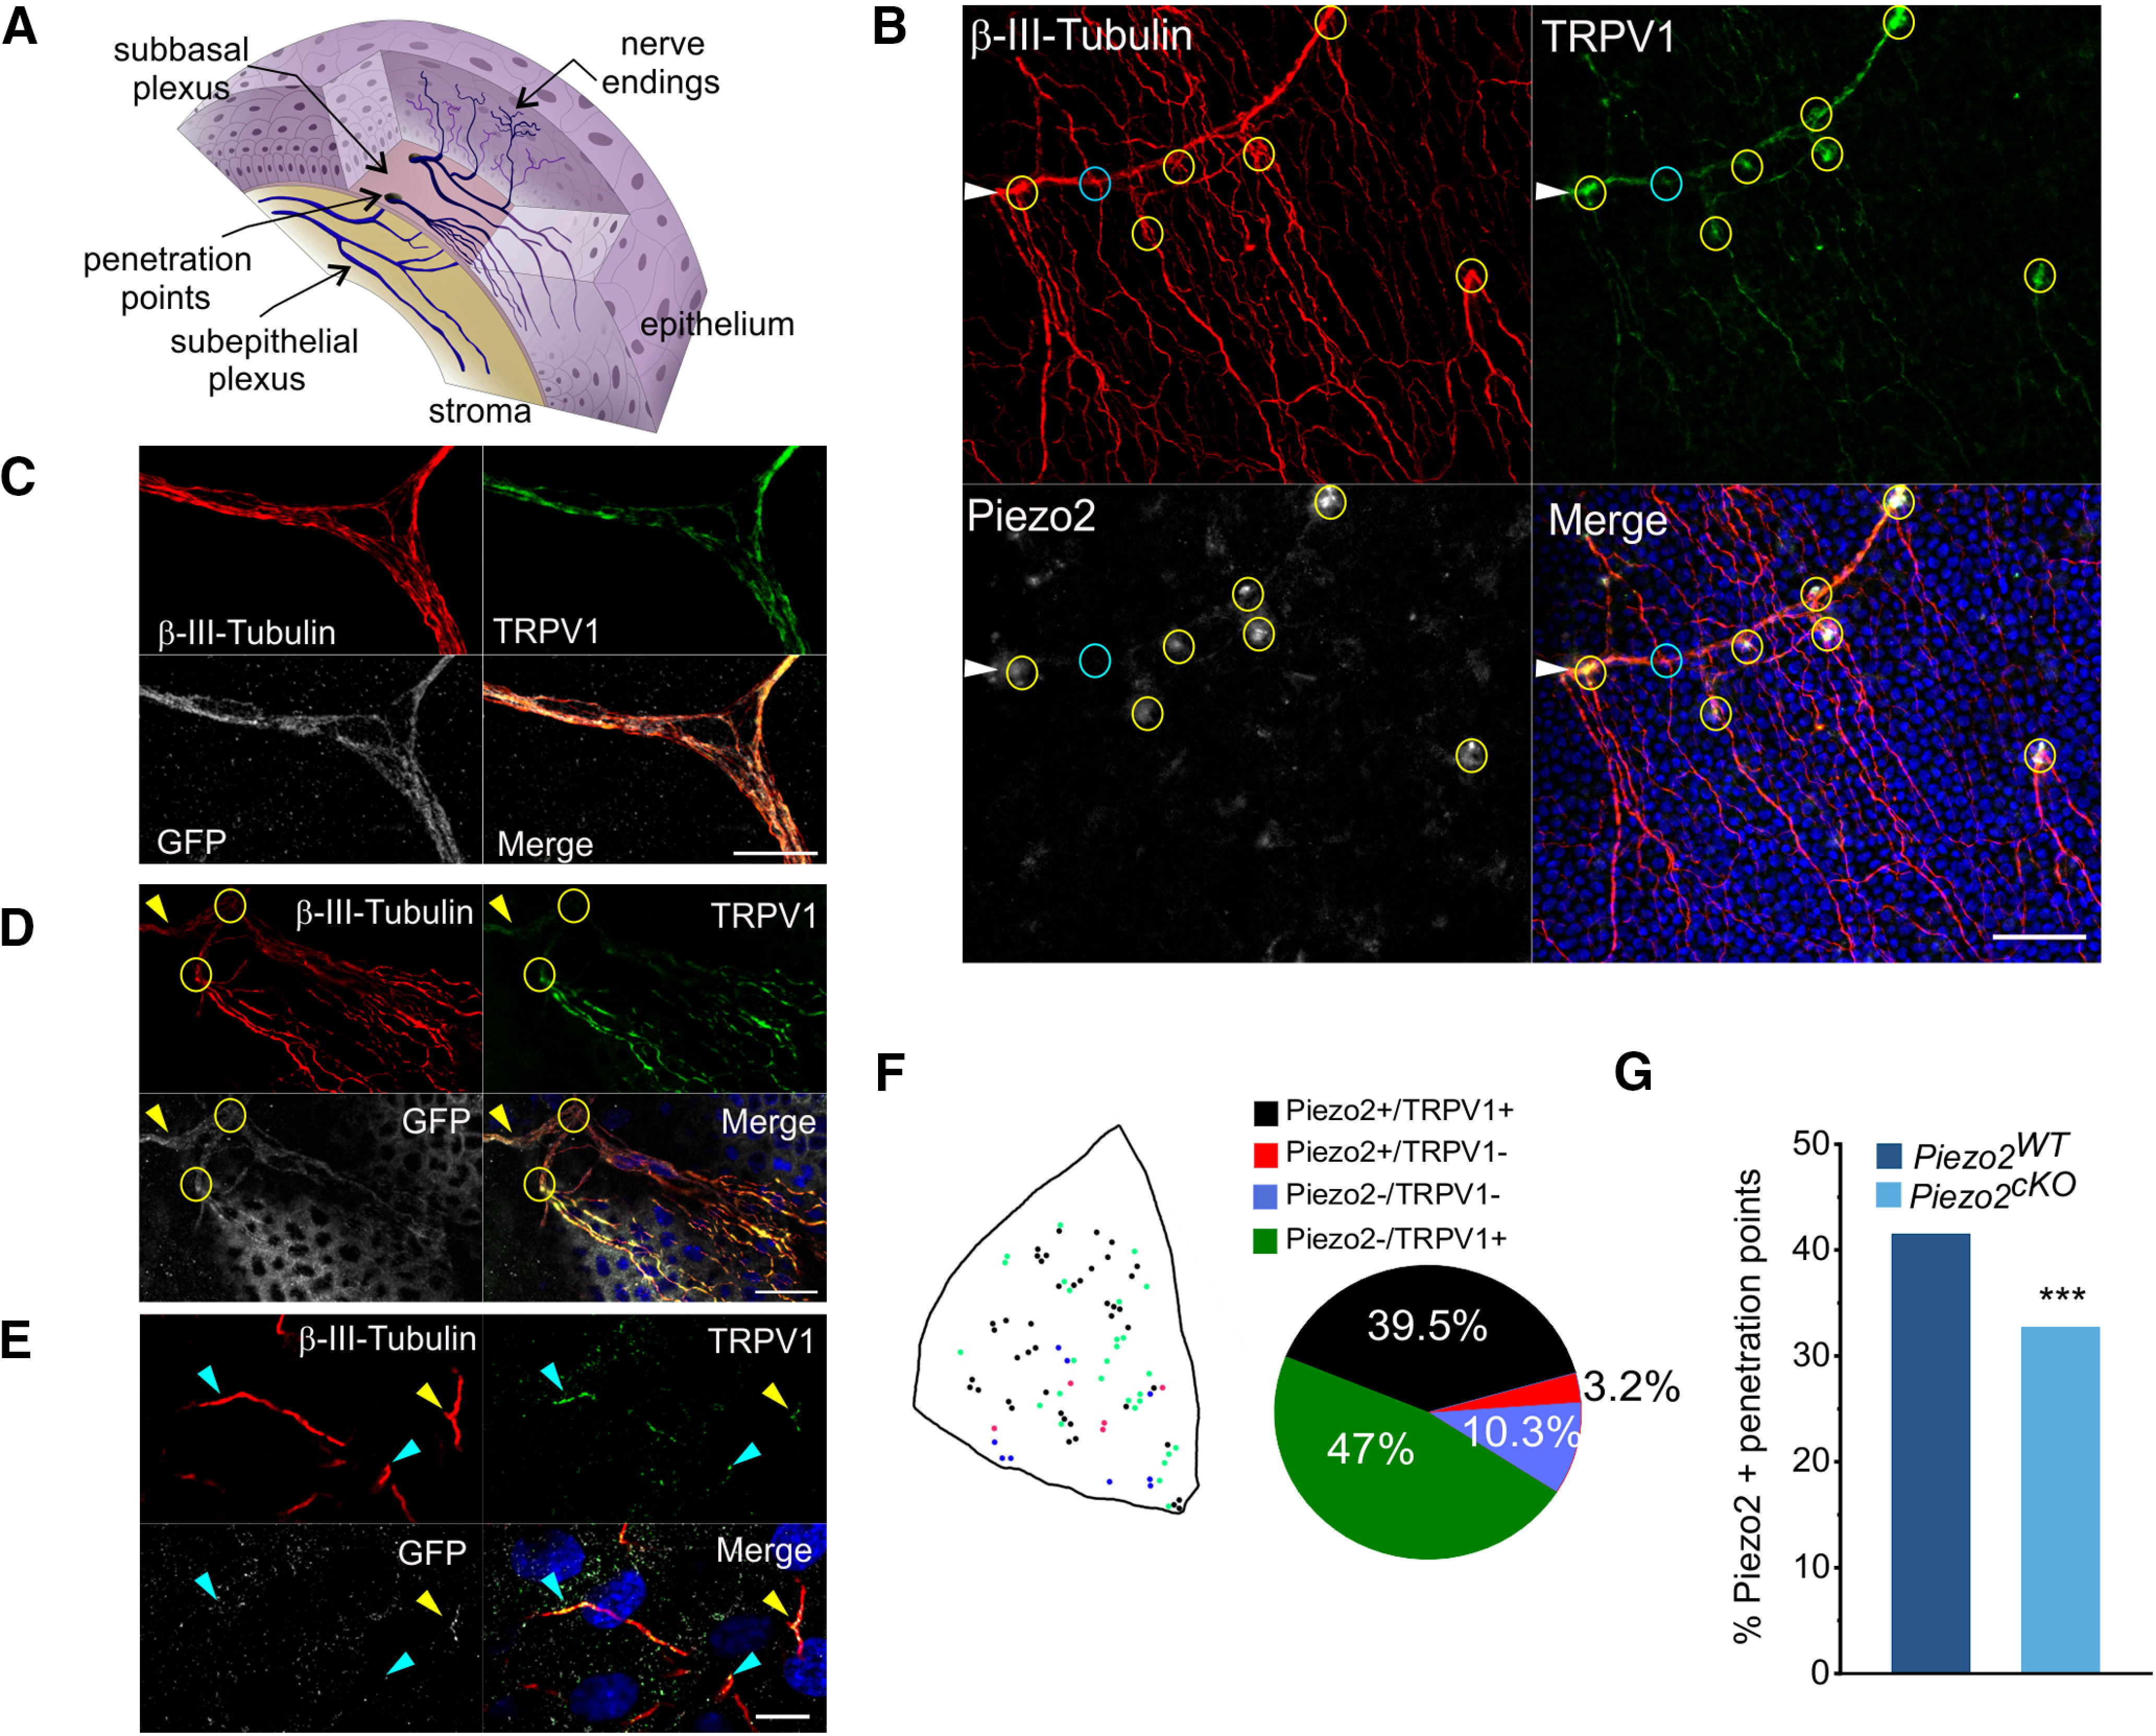
Figure 7.

Piezo2 is detected in mouse corneal nerve terminals. A, Sketch of the neuroanatomical structure of the cornea. The subepithelial nerves in the stroma traverse the basal lamina through penetration points and branch into sub-basal plexuses that give rise to ascending intraepithelial terminals. B, Z-stacked confocal images of a whole-mount cornea from a C57BL/6J mouse, showing a subepithelial bundle (arrowhead), points where subepithelial nerves penetrate the basal lamina (circles) and thinner sub-basal nerves after penetrating through the basal lamina. Nerves were immunolabeled with anti-β-III-tubulin (red), nerve fibers immunopositive for TRPV1 display green fluorescence, and those immunopositive to the Piezo2 antibody appear stained in white. Yellow circles indicate the penetration points with nerve bundles positive for TRPV1 and Piezo2, and a cyan circle points to a penetration point positive only for TRPV1. Nuclei of the epithelial cells are stained with Hoechst 33342 stain (blue). Scale bar, 50 µm. C–E, Confocal images of whole-mount corneas from Piezo2-GFP-IRES-Cre mice immunolabeled with anti-β-III-tubulin (red), anti-TRPV1 (green), and anti-GFP (white) antibodies. C, Subepithelial nerve bundle containing many individual axons in the stromal layer. Nerve bundles were positive for TRPV1 and Piezo2. Scale bar, 10 µm. D, Circles indicate points where a subepithelial nerve (arrowhead) penetrates the basal lamina and divides into sub-basal nerves. Scale bar, 25 µm. E, Simple nerve ending in the corneal epithelium layer that coexpresses Piezo2 and TRPV1 (yellow arrowhead). Cyan arrowheads point to terminals positive for TRPV1, and negative for Piezo2. Nuclei of the epithelial cells are stained with Hoechst 33342 stain (blue). Scale bar, 10 µm. F, Schematic representation of the penetration points of nerve bundles in a corneal quadrant; color code indicates the expression of Piezo2 and/or TRPV1. Proportion of penetration points expressing Piezo2+/TRPV1+, Piezo2+/TRPV1–, Piezo2–/TRPV1–, or Piezo2–/TRPV1+ (n = 1347 from four corneas, divided into four quadrants) is represented in the pie chart. G, Proportion of penetration points positive for Piezo2 in wild-type and Piezo2cKO mice. ***p < 0.001, Z-test analysis.
