Figure 1.
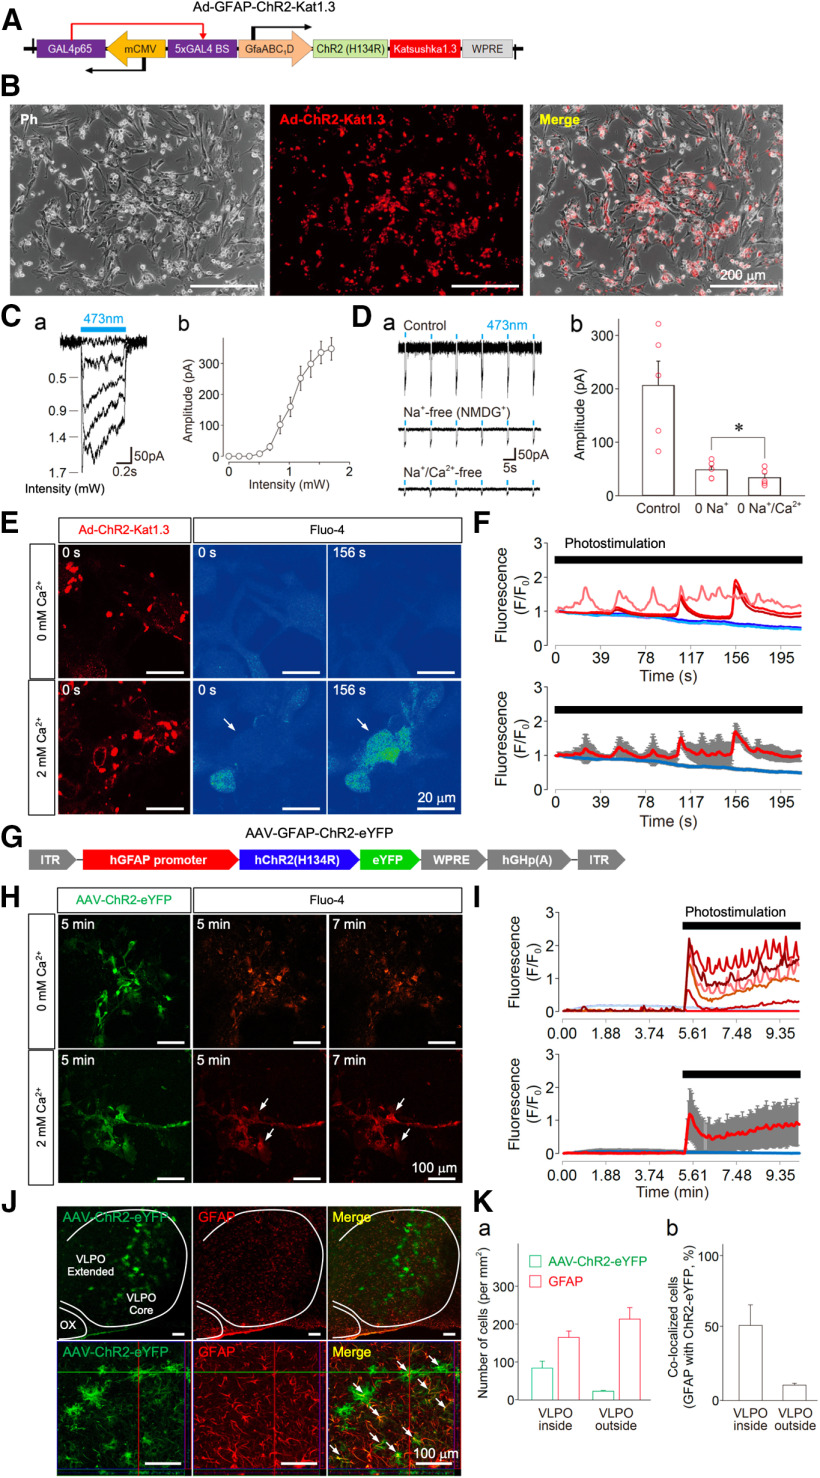
Functional expression of ChR2 in astrocytes. A, An illustration of the adenoviral vector containing the ChR2 construct (Ad-ChR2-Kat1.3; Ad-sGFAP-ChR2(H134R)-Katushka1.3). The expression of ChR2 is controlled by GfaABC1D, a shortened version of the GFAP promoter. mCMV operating in the antisense orientation drives the expression of a chimeric transcriptional activator Gal4p56, while the specificity of expression in both directions is determined by GfaABC1D. B, Phase contrast (Ph, left), fluorescence (middle), and superimposed (right) images of cultured astrocytes infected with Ad-ChR2-Kat1.3. C, Typical traces of membrane currents induced by different photostimulation (473 nm) intensities in cultured astrocytes (a). Photostimulation intensity-current relationship in cultured astrocytes (b). All points and error bars represent the mean and SEM from four experiments. D, Typical traces of photostimulation (473 nm)-induced membrane currents in a standard external solution (upper), a Na+-free (replaced with equimolar NMDG+) solution (0 Na+; middle), and a solution that was both Na+-free and Ca2+-free (0 Na+/Ca2+; lower; a). Changes in photostimulation-induced membrane currents for each condition (b). All columns and error bars represent the mean and SEM from five experiments. Note that the photostimulation-induced membrane currents in the Na+-free solution were significantly reduced by omission of extracellular Ca2+; *p < 0.05; paired t test; t(4) = 4.21, p = 0.0136. E, Typical fluorescence images of ChR2-expressing astrocytes displaying the Ca2+ response on photostimulation. Cultured astrocytes were infected with Ad-ChR2-Kat1.3 and loaded with Fluo-4AM. Note that photostimulation induced a profound increase in intracellular Ca2+ concentration (arrows) in the presence of 2 mm extracellular Ca2+. F, Time courses of individual (upper) and mean (lower) Fluo-4AM fluorescence intensity changes obtained from three astrocytes on photostimulation in the absence or presence of extracellular Ca2+(blue lines, 0 mm; red lines, 2 mm). Photostimulation (1.7 mW, 1 Hz, horizontal bar) was applied to Fluo-4AM-loaded astrocytes. Fluorescence intensities were measured using Zeiss ZEN Microscope software and are expressed as the ratio of (F – F0)/F0, where F0 is the base level fluorescence intensity in cell bodies before any treatment. All measurements were corrected for background fluorescence. Increases in the fluorescence ratio that were >0.1 were considered to be significant changes; basal level fluorescence values exhibited a peak (F – F0)/F0 ratio of 0.01 ± 0.01 on average. The results are representative of three experiments. G, An illustration of the adeno-associated viral vector containing the ChR2 construct (AAV-ChR2-eYFP; AAV-GFAP-hChR2(H134R)-eYFP). The expression of ChR2 is controlled by GfaABC1D, a shortened version of the GFAP promoter. H, Typical fluorescence images of AAV-ChR2-eYFP-expressing astrocytes displaying a Ca2+ response on photostimulation. Cultured astrocytes were infected with AAV-ChR2-eYFP and loaded with rhodamine 2. Note that photostimulation induced a profound increase in intracellular Ca2+ concentration (arrows) in the presence of 2 mm extracellular Ca2+. I, Changes in individual (upper) and mean (lower) rhodamine 2 fluorescence intensities obtained from six astrocytes on photostimulation in the absence or presence of extracellular Ca2+ (blue lines, 0 mm; red lines, 2 mm). Photostimulation (1.7 mW, 1 Hz, horizontal bar) was applied to rhodamine 2-loaded astrocytes. The results are representative of three experiments. J, Fluorescence images displaying AAV-ChR2-eYFP expression in the VLPO area. The VLPO regions in the brain slices were subjected to immunofluorescence analysis to identify AAV-ChR2-eYFP (green) expression in astrocytes (GFAP, red), which was confirmed by reconstructed Z-section images (bottom panels, high-power images). Arrows indicate the co-localization of AAV-ChR2-eYFP and GFAP. ChR2 expression (green) was not co-localized with either Iba-1 or NeuN. Dotted lines indicate the VLPO (core and extended region) and optic chiasm (OX) areas. The results are representative of six experiments. K, Quantification of AAV-ChR2-eYFP-positive and GFAP-positive cells around the VLPO region. Shown are the number of cells (a) and their co-localization (b). Each column and error bar represents the mean and SD from three experiments.

