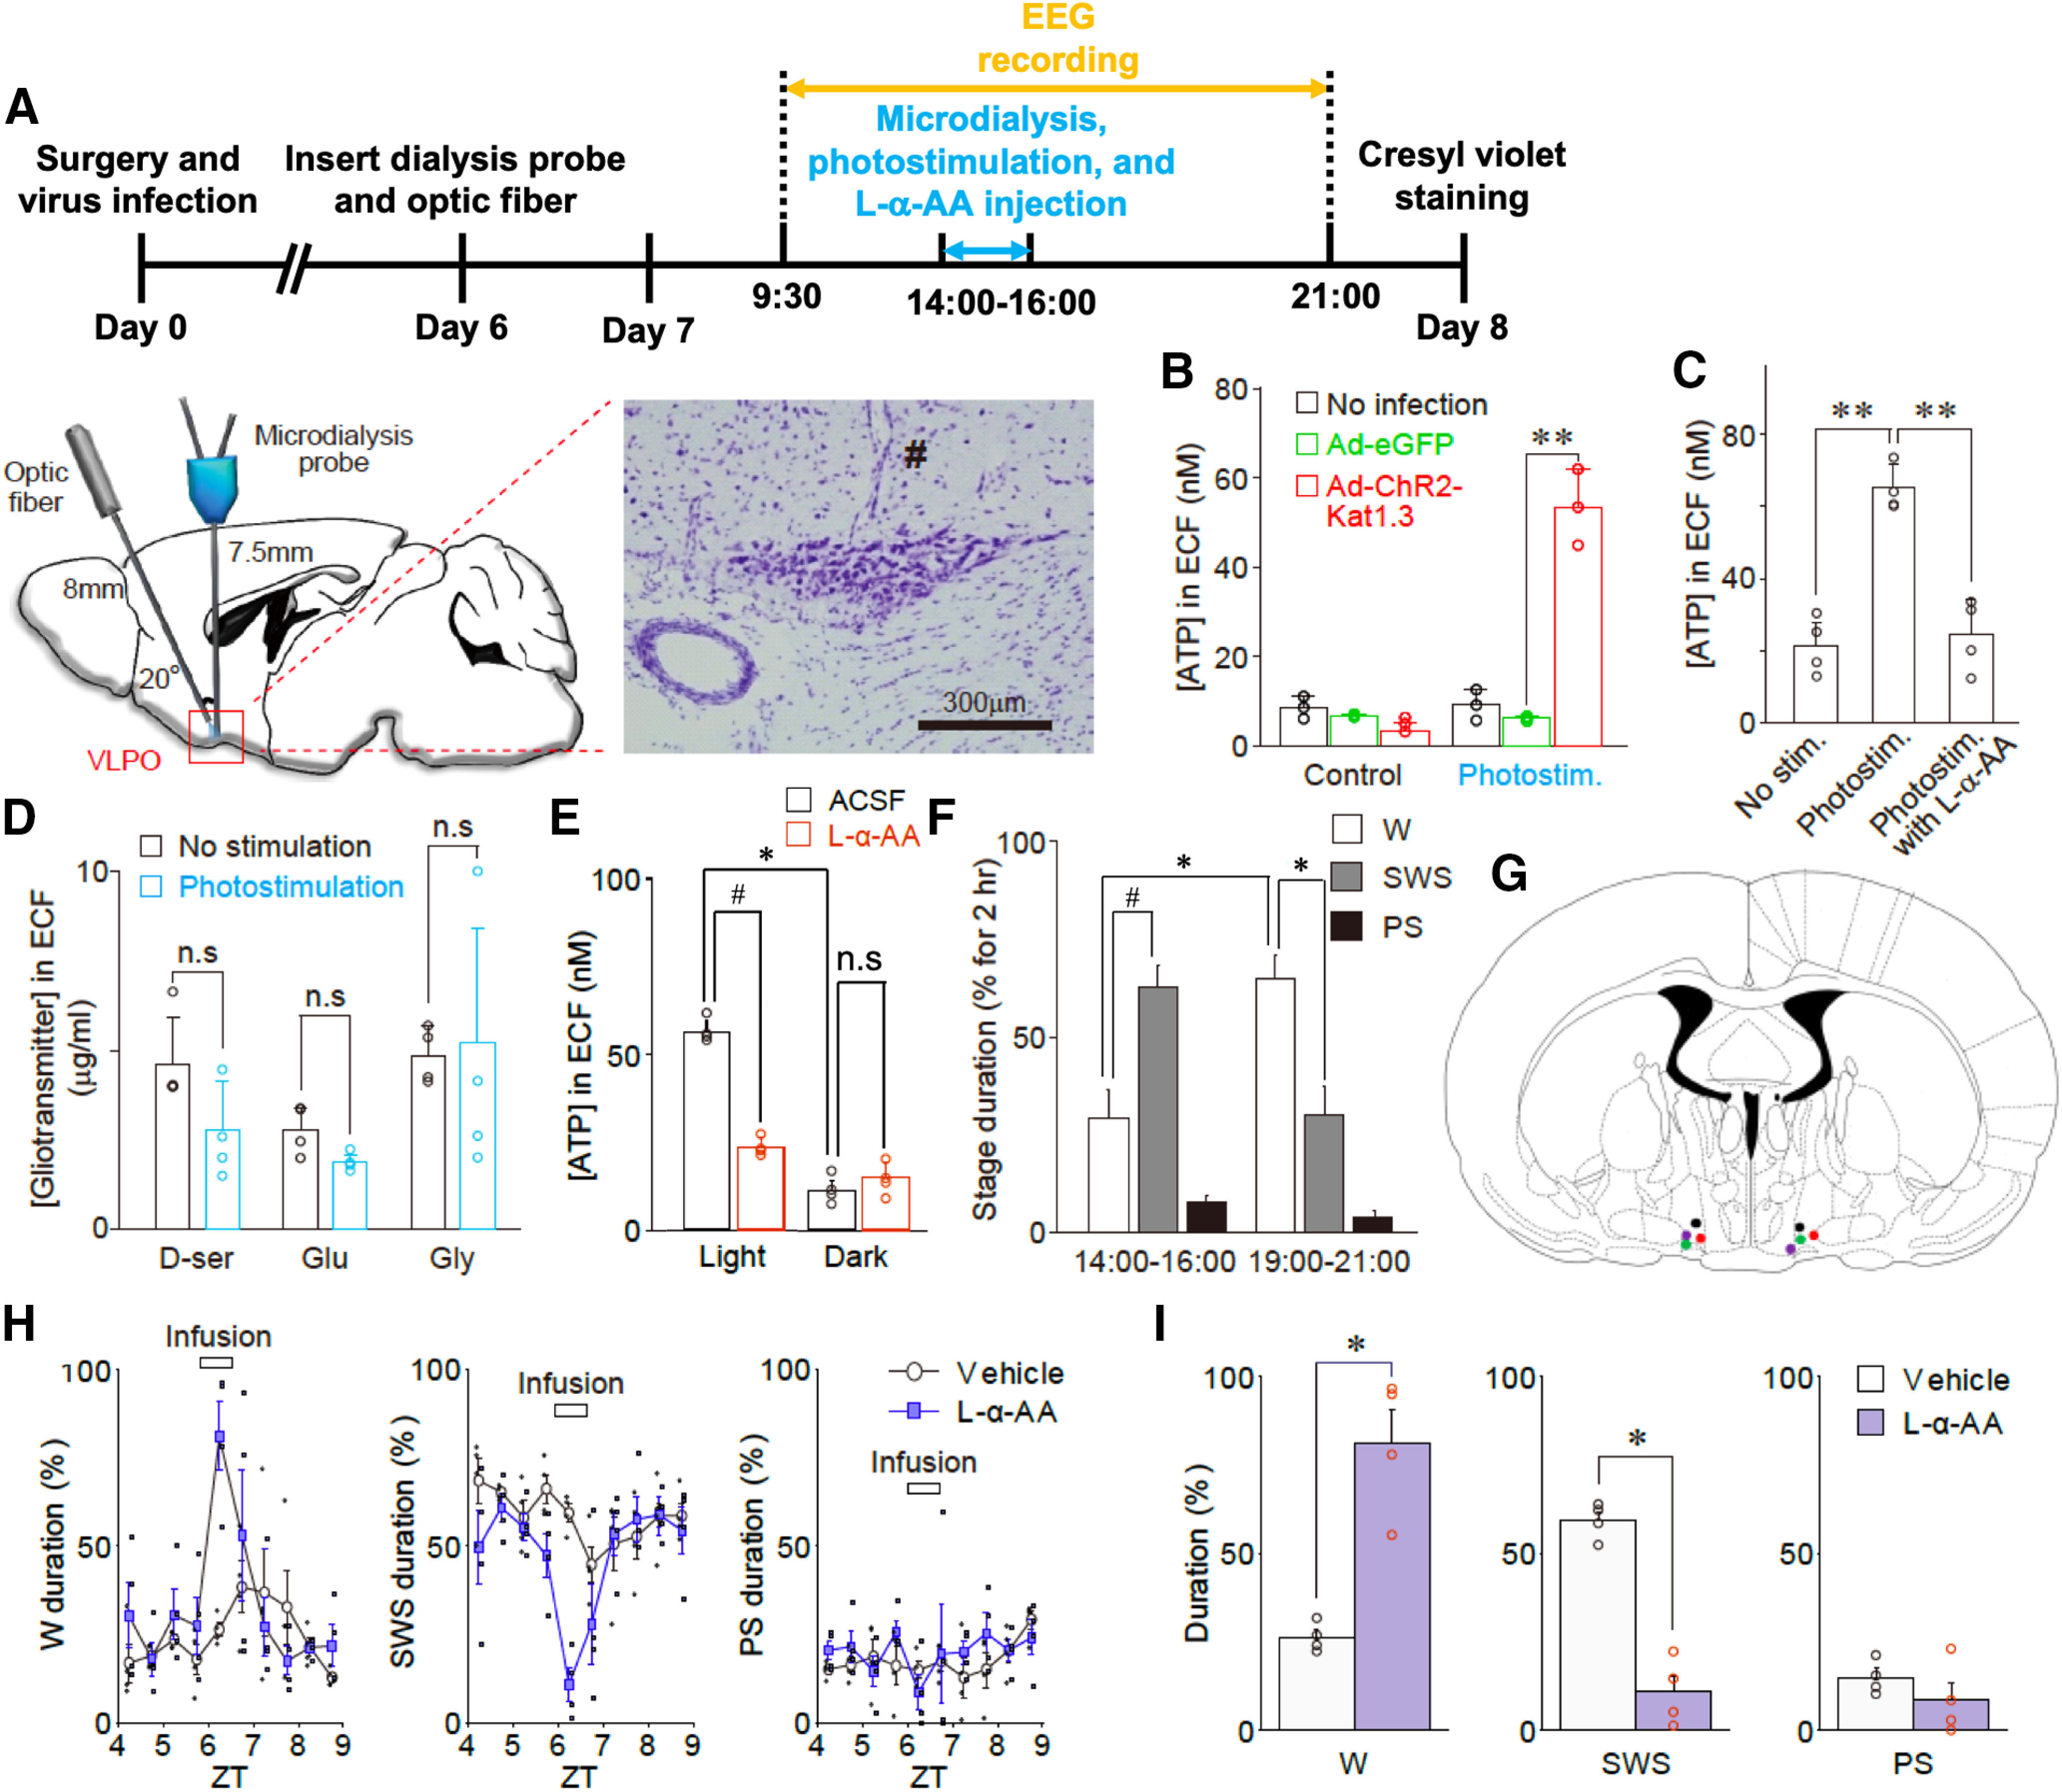
Figure 10.

Astocytes release ATP during optogenetic stimulation in vivo. A, Experimental timeline (top) and schematic illustration of microdialysis of the ECFs in the VLPO region during photostimulation (bottom). The microdialysis site was validated by cresyl violet staining at the end of the experiment (right panel); # represents the insertion site of the microdialysis probe. The results are representative of nine experiments. B, The ATP concentration in the dialysate (ECF) before and after photostimulation (120 min). The ATP concentration was measured using a bioluminescence assay. Open circles represent the individual results (n = 3), whereas columns and error bars represent the mean and SD from three experiments; **p < 0.01; unpaired t test; t(4) = 9.77, p = 0.0006. C, Microdialysis was performed at a flow rate of 0.5 ml/min with or without photostimulation of the VLPO region for 120 min in the presence or absence of L-α-AA (10 nm, a metabolic inhibitor of astrocytes). L-α-AA (3 μl) was microinjected into the VLPO region 10 min before photostimulation. The concentration of ATP in the VLPO dialysate (ECF) was measured using a bioluminescence assay. Each column and error bar represents the mean and SD from four experiments; **p < 0.01; one-way ANOVA; F(2,9) = 40.32, p = 0.0001. D, Photostimulation (120 min)-induced changes in D-serine, glutamate, and glycine levels in microdialysates obtained from the VLPO region. Animals were injected with AAV-ChR2-eYFP. The concentrations of D-serine, glutamate, and glycine were determined using an amino acid analyzer; Each column and error bar represents the mean and SD from 4 experiments; n.s., not significant; unpaired t test. E, The concentration of ATP in the VLPO dialysate collected during the light (2–4 P.M.) or dark (7–9 P.M.) period in the presence or absence of L-α-AA (10 nm) was measured by a bioluminescence assay. Each column and error bar represents the mean and SD from four experiments; n.s., not significant; *p < 0.05, paired t test, t(3) = 19.79, p = 0.0003; #p < 0.05, paired t test, t(3) = 10.79, p = 0.0017. F, The percentage of wake (W), SWS, and PS in the representative wake (dark: 7–9 P.M.) or sleep (light: 2–4 P.M.) period; Each column and error bar represents the mean and SEM from four experiments; *p < 0.05, paired t test, wake duration, t(3) = 5.01, p = 0.0153; SWS duration, t(3) = 9.43, p = 0.0025; #p < 0.05, paired t test, t(3) = 5.53, p = 0.0116. G, A representative image showing each microinjection site of L-α-AA as indicated on the coronal section drawing modified from the rat brain atlas. H, Changes in the duration of the sleep-wake states [wake (W), SWS, and PS] at 30-min intervals before, during, and after treatment with saline or L-α-AA (horizontal bar). Saline or L-α-AA (3 μl, 10 nm) was directly microinjected into the VLPO region for 30 min at a rate of 0.1 μl/min. Each column and error bar represents the mean and SEM from four experiments; I, The duration of the sleep-wake states during microinjection of saline or L-α-AA. Each column and error bar represents the mean and SEM from four experiments; *p < 0.05; unpaired t test; W duration, t(6) = 5.57, p = 0.0014; SWS duration, t(6) = 9.02, p = 0.0001.
