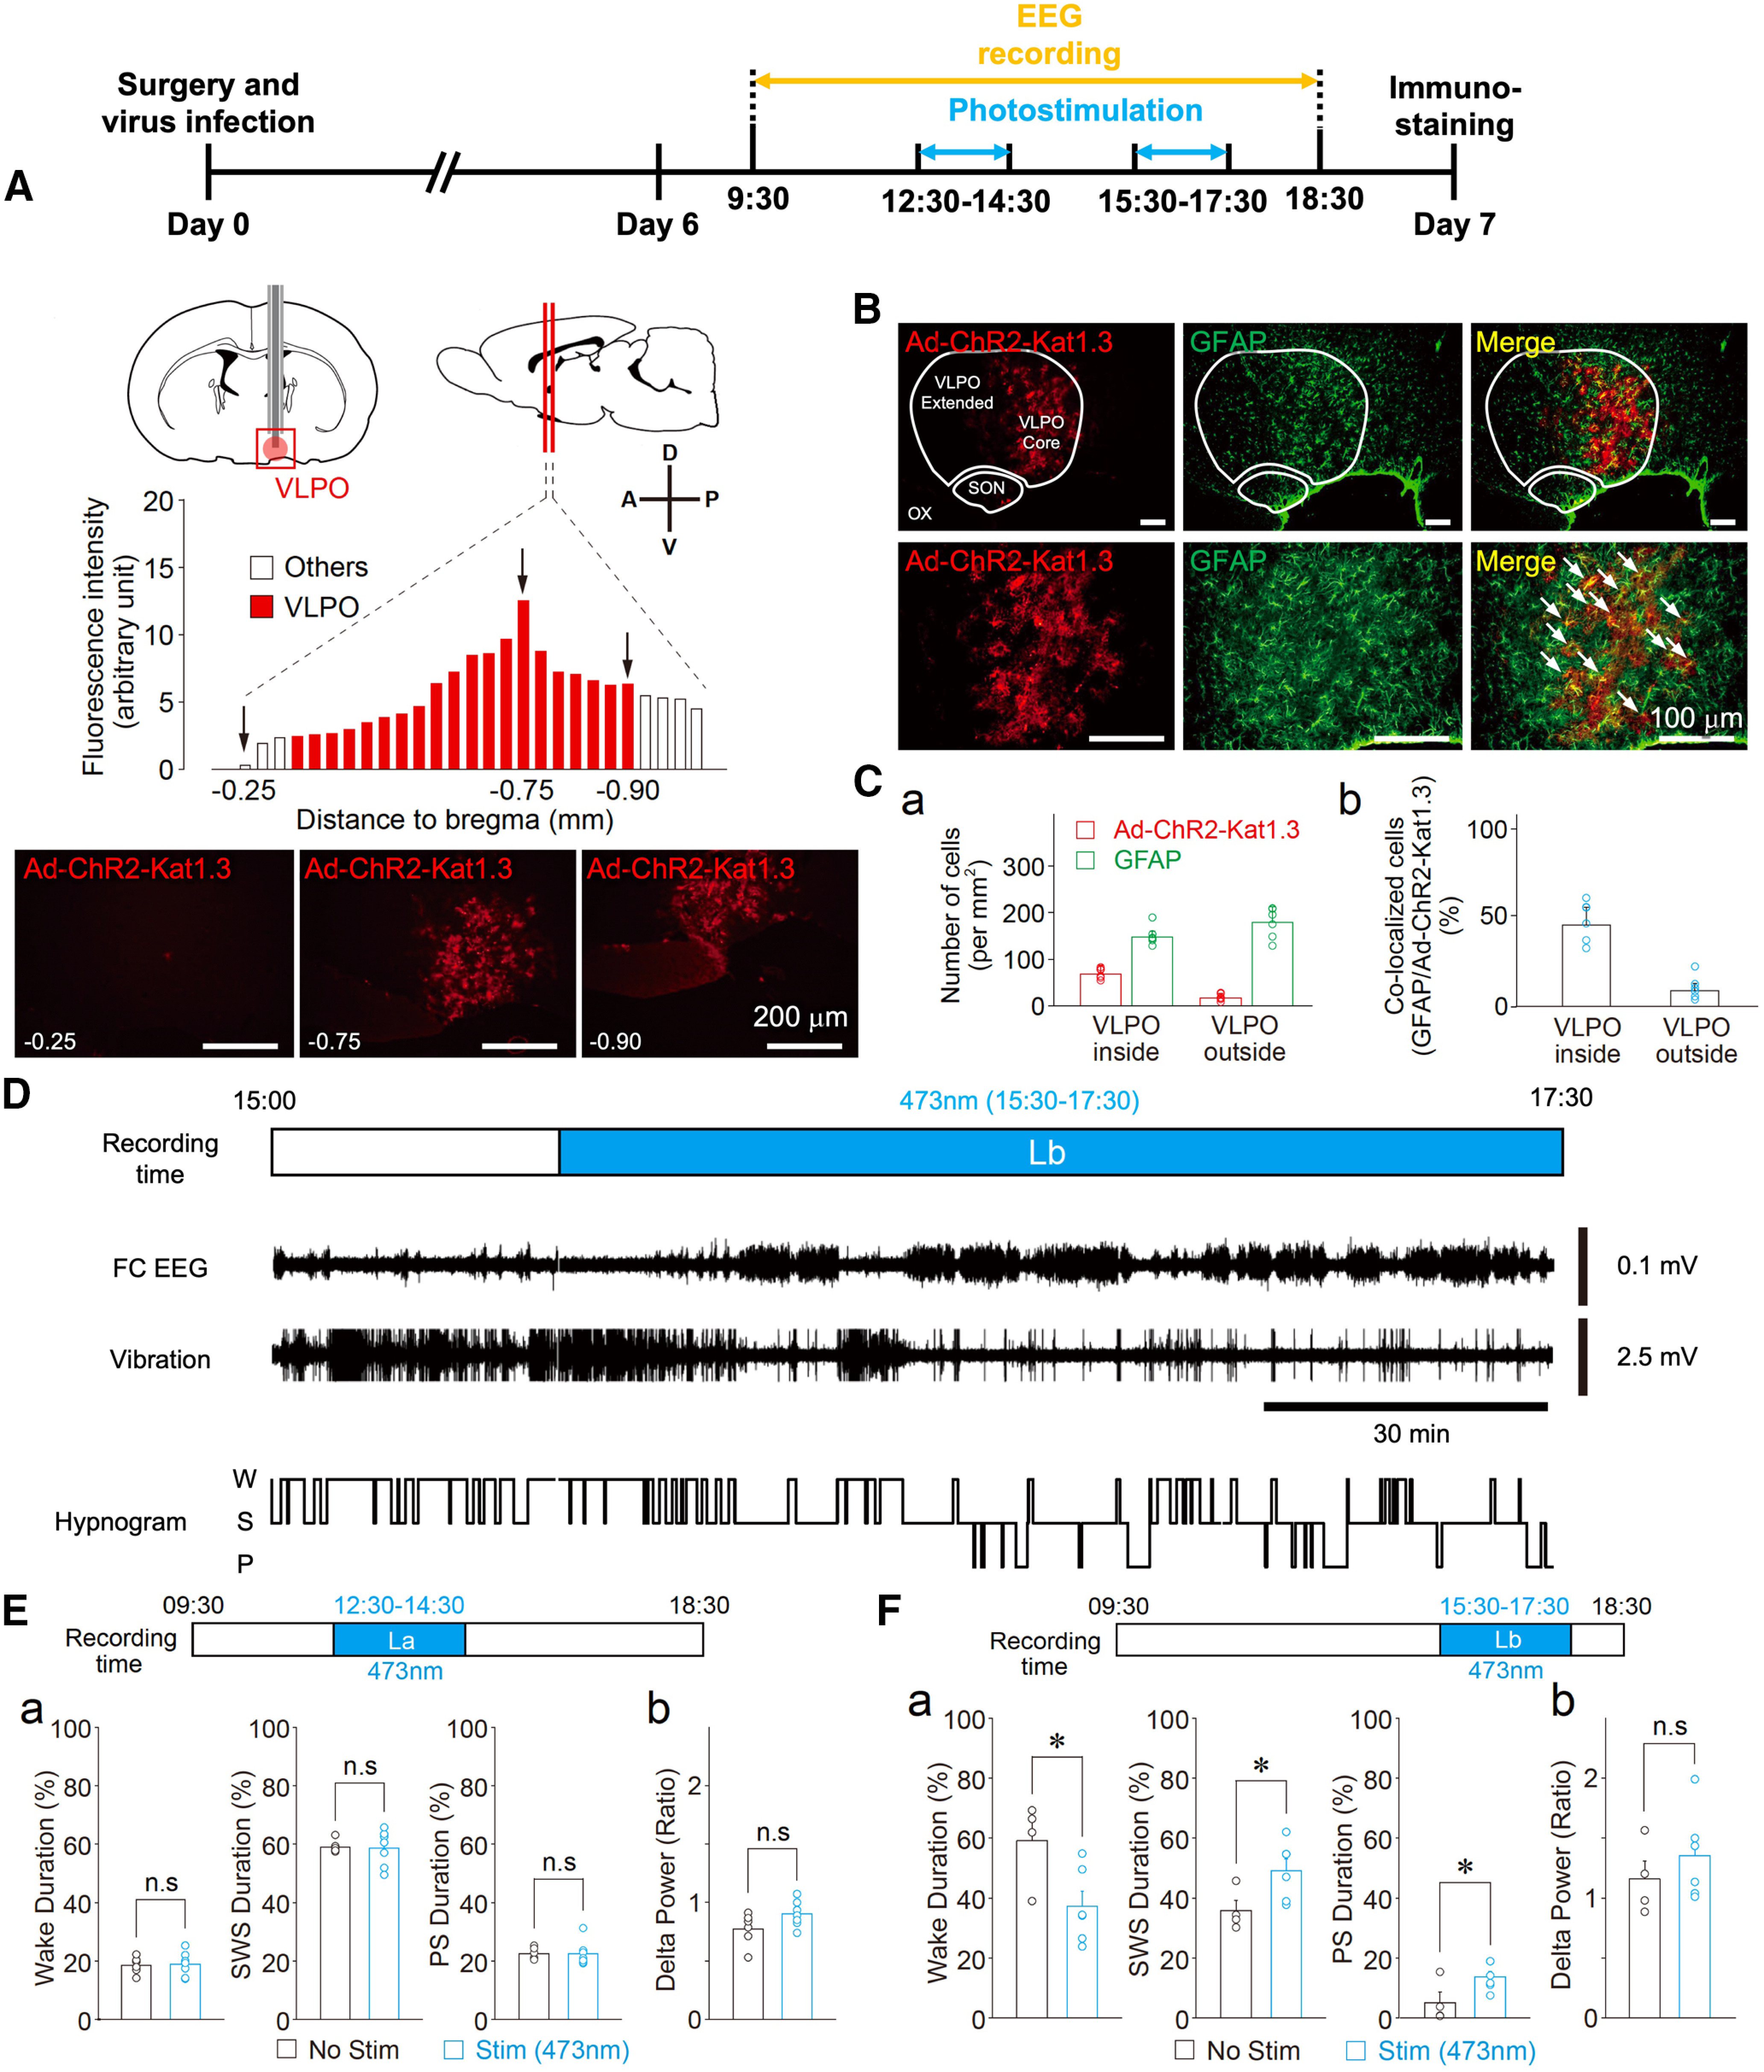
Figure 4.

Optogenetic stimulation of the VLPO astrocytes promotes sleep when rats are in a waking state. A, Timeline of experiments (top). Visual representation of the cannula placement site used to stimulate VLPO astrocytes and the quantification of the ChR2-Kat1.3 expression profile in the VLPO area. Ad-ChR2-Kat1.3 was delivered to the VLPO area using a guide cannula. The expression of ChR2 fused to Katushka1.3 was confirmed by fluorescence (red) detected in serial coronal sections of the brain. The VLPO area corresponds to the position 0.3–0.9 mm posterior to bregma (red columns). The graph shows the quantification of ChR2 expression in the serial sections. Representative fluorescence images are also shown in the lower panel. Expression of Ad-ChR2-Kat1.3 was confirmed in 15 animals, among which four animals were subjected to serial brain sectioning and fluorescence analysis. B, Fluorescence images of the VLPO region. Note that Ad-ChR2-Kat1.3 (red) is co-localized with GFAP (green). Dotted lines indicate the areas of the VLPO region (core and extended region), supraoptic nucleus (SON), and optic chiasm (OX). The results are representative of six experiments. Arrows in the magnified images (lower row) indicate co-localization of Ad-ChR2-Kat1.3 and GFAP. C, Quantification of cells positive for Ad-ChR2-Kat1.3 and GFAP around the VLPO region. Shown are the number of cells (a) and their co-localization (b). Each column and error bar represents the mean and SD from six experiments. D, Representative traces of a frontal cortex EEG (FC EEG), motor activity-related vibration, and a hypnogram before and during (Lb) photostimulation. W, wake; S, SWS; and P, PS. E, Effects of photostimulation during the 12:30 P.M. to 2:30 P.M. (La) period. The duration of sleep-wake states (a) in the stimulation group (Stim, n = 7) was similar to that of the control group (No Stim, n = 6). The δ power during SWS was not affected by photostimulation (b); Each column and error bar represents the mean and SD from 6-7 experiments; n.s., not significant; unpaired t test. F, Effects of photostimulation during the 3:30 to 5:30 P.M. (Lb) period. The duration of sleep (a) in the stimulation group (Stim, n = 6) was increased relative to that in the control group (No Stim, n = 4). The δ power during SWS was not affected by photostimulation (b); Each column and error bar represents the mean and SD from 4-6 experiments; *p < 0.05; n.s., not significant; unpaired t test; Wake, t(8) = 2.62, p = 0.0305; SWS, t(8) = 2.37, p = 0.0446; PS, t(8) = 2.37, p = 0.0453.
