Figure 4.
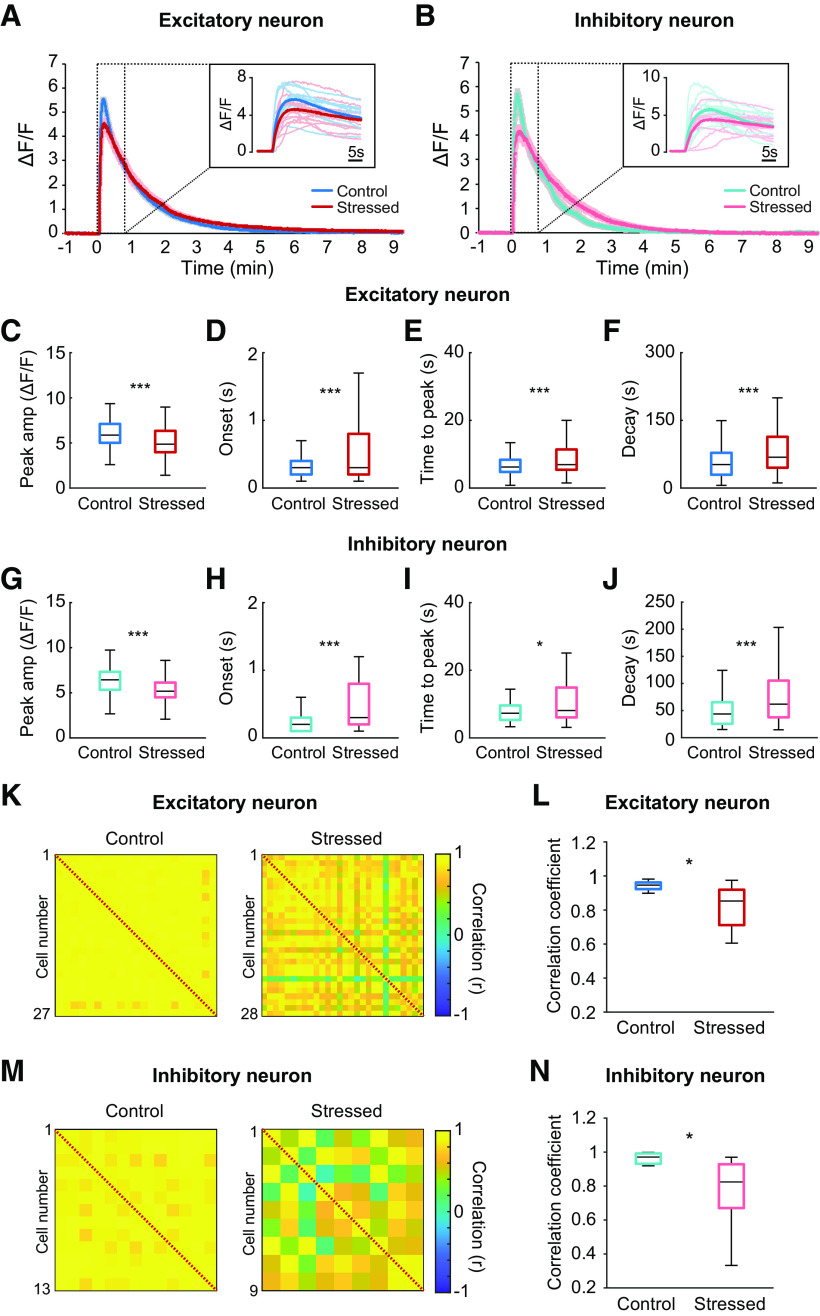
Impairment of calcium transients from both excitatory and inhibitory neurons and neuronal coherence elicited by NMDA simulation under acute stress. A, Average calcium traces of excitatory neurons in response to NMDA stimulation in control and acutely stressed mice. Inset, Individual calcium traces and average calcium traces during the 30 s after the stimulation. B, Average calcium traces of inhibitory neurons in response to NMDA stimulation in control and acutely stressed mice. Inset, Individual calcium traces and average calcium traces during the 30 s after stimulation. C–F, Peak amplitudes, onset times, times to peak, and decay times to half-maximum for calcium transients from excitatory neurons in response to NMDA stimulation in control and stressed mice (control: n = 11 slices; stressed: n = 12 slices). G–J, Peak amplitudes, onset times, times to peak, and decay times to half-maximum for calcium transients from inhibitory neurons in response to NMDA stimulation in control and stressed mice (control: n = 11 slices; stressed: n = 12 slices). K, M, Correlation matrices between excitatory neurons and between inhibitory neurons from control (left) and stressed mice (right) during the 1 s following NMDA stimulation. Right, Colors in scale represent correlation values. L, N, Box plots of the mean correlation coefficients of excitatory (L) and inhibitory (N) neurons from control and stressed mice (control: n = 11 slices; stressed: n = 12 slices). Box-and-whisker plots represent the data as described in the legend to Figure 2. *p < 0.05; ***p < 0.001; Mann–Whitney U test.

