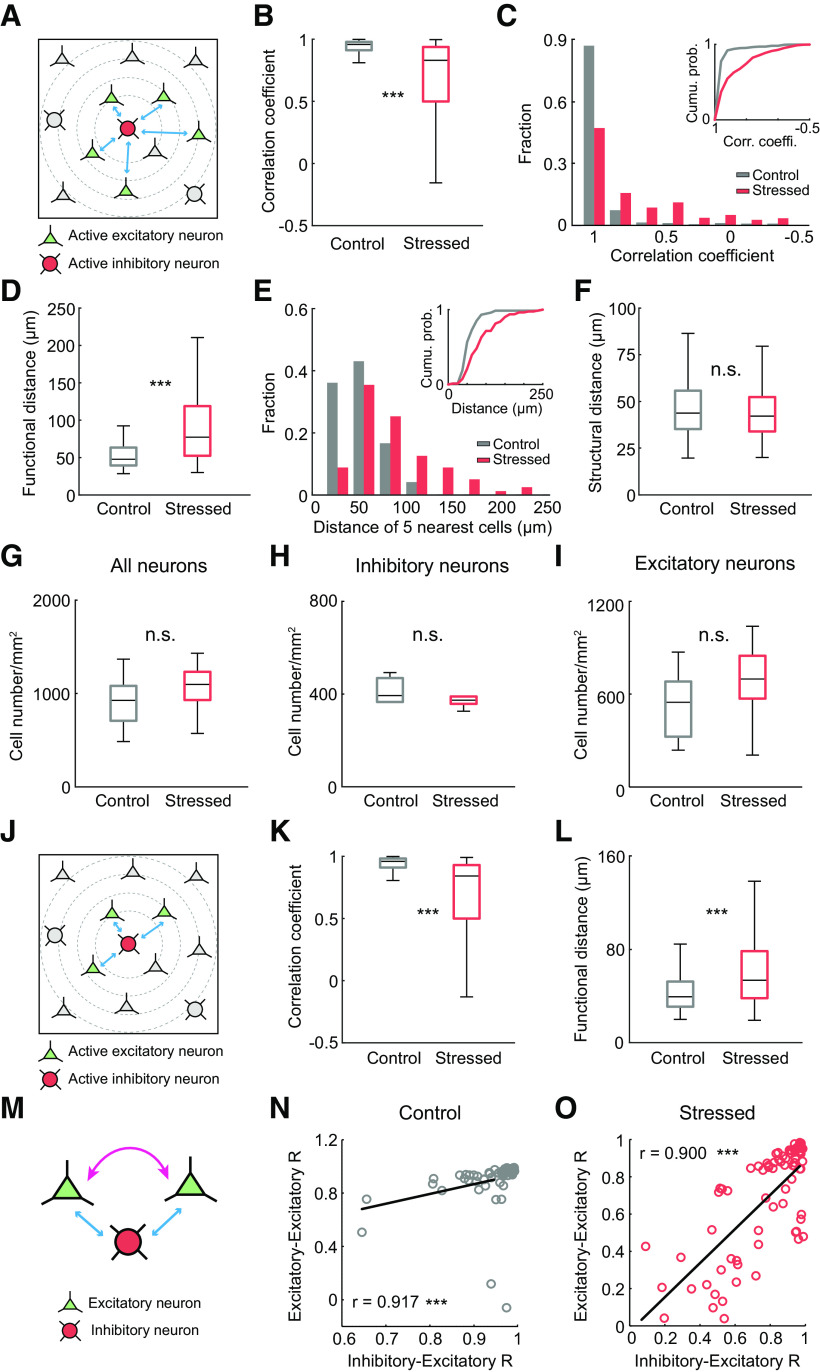
Figure 5.
Impairment of neural coherence between excitatory and inhibitory neurons under acute stress. A, Schematics represent the neural connections between a single GABAergic interneuron and the 5 nearest pyramidal cells. Red cell is an active GABAergic neuron. Green cells are the 5 closest active pyramidal neurons to the GABAergic neuron. B, Box plot of the mean correlation coefficients between excitatory and inhibitory neurons (control: n = 72 pairs from 11 slices; stressed: n = 79 pairs from 12 slices). C, Histogram represents the distribution of the correlation coefficients for control and stressed mice. Inset, A cumulative probability plot of the correlation coefficients. D, Box plot represents the mean functional distances of the 5 nearest pyramidal neurons from a single GABAergic interneuron (control: n = 72 pairs from 11 slices; stressed: n = 79 pairs from 12 slices). E, Histogram represents the functional distances of the 5 nearest pyramidal neurons from a single GABAergic interneuron in control and stressed mice. Inset, A cumulative probability plot of the mean functional distances. F, Box plot represents the mean structural distance of the 5 nearest pyramidal neurons from a single GABAergic interneuron (control: n = 277 pairs from 6 slices; stressed: n = 273 pairs from 6 slices). G–I, Box plot represents the numbers of excitatory, inhibitory, and total neurons in control and stressed mice (control: n = 6 slices; stressed: n = 6 slices). J, Schematic images represent the neural connections between a single GABAergic interneuron and the 3 nearest pyramidal cells. Red cell is a single GABAergic neuron. Green cells are the 3 pyramidal neurons nearest to the GABAergic neuron. K, Box plot of the mean correlation coefficients between excitatory and inhibitory neurons (control: n = 72 pairs from 11 slices; stressed: n = 79 pairs from 12 slices). L, Box plot represents the mean functional distances of the 3 nearest pyramidal neurons from a single GABAergic interneuron (control: n = 72 pairs from 11 slices; stressed: n = 79 pairs from 12 slices). M, Schematic images showing the correlations between excitatory neurons and the correlations between excitatory and inhibitory neurons. N, O, Scatter plots represent the linear relationships of correlations between excitatory neurons and correlations between excitatory and inhibitory neurons in control (N) and stressed mice (O) (control: n = 62 pairs from 11 slices; stressed: n = 77 pairs from 12 slices). Box-and-whisker plots represent the data as described in the legend to Figure 2. ***p < 0.001; n.s., not significant; Mann–Whitney U test and Spearman's test.

