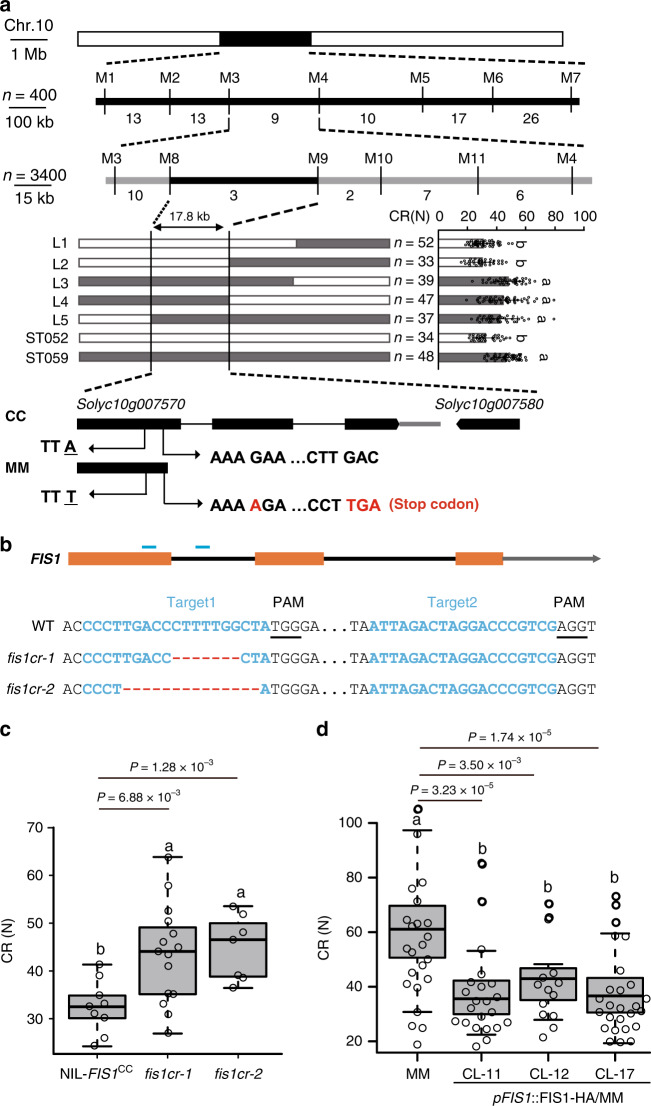
Fig. 2. FIS1 is responsible for fruit firmness formation in tomato.
a Fine mapping of qFIS1. Top panel: positional cloning narrowed qFIS1 to the DNA segment between markers M8 and M9. The numbers below the bars indicate the number of recombinants. n = plant number. Middle panel: high-resolution mapping of qFIS1 (left) and CR of recombinant progeny (right). Error bars, mean ± SD. n = fruit number. Different letters indicate significant differences according to the Tukey–Kramer test (P < 0.05). P = 3.58 × 10⁻¹⁸ (L1 and ST059), P = 9.91 × 10⁻¹⁵ (L2 and ST059), P = 0.55 (L3 and ST059), P = 0.28 (L4 and ST059), P = 0.07 (L5 and ST059), P = 1.65 × 10⁻¹² (ST052 and ST059). Bottom panel, genomic diagram showing the two candidate genes. In addition to one SNP, a single nucleotide insertion in the 1st exon of Solyc10g007570 in MM causes early termination. b FIS1 mutations generated by CRISPR/Cas9 using two single-guide RNAs. Blue lines indicate the target sites of the guide RNAs. Black lines indicate the protospacer-adjacent motif (PAM). The sequences of the two fis1 mutants in NIL-FIS1CC are shown. c Box plots of red ripe fruit CR for fis1cr-1/2 mutants and NIL-FIS1CC. n = 9, 15, and 17 fruits. Box edges represent the 0.25 and 0.75 quantiles, and the bold lines indicate median values. Whiskers indicate 1.5 times the interquartile range. Different letters indicate significant differences according to the Tukey–Kramer test (P < 0.05). d Box plots of red ripe fruit CR for MM and three transgenic complementation lines (CL-11, CL-12, CL-17). n = 23, 22, 13, and 27 fruits. Box edges represent the 0.25 and 0.75 quantiles and the bold lines indicate median values. Whiskers indicate 1.5 times the interquartile range. Different letters indicate significant differences according to the Tukey–Kramer test (P < 0.05).

