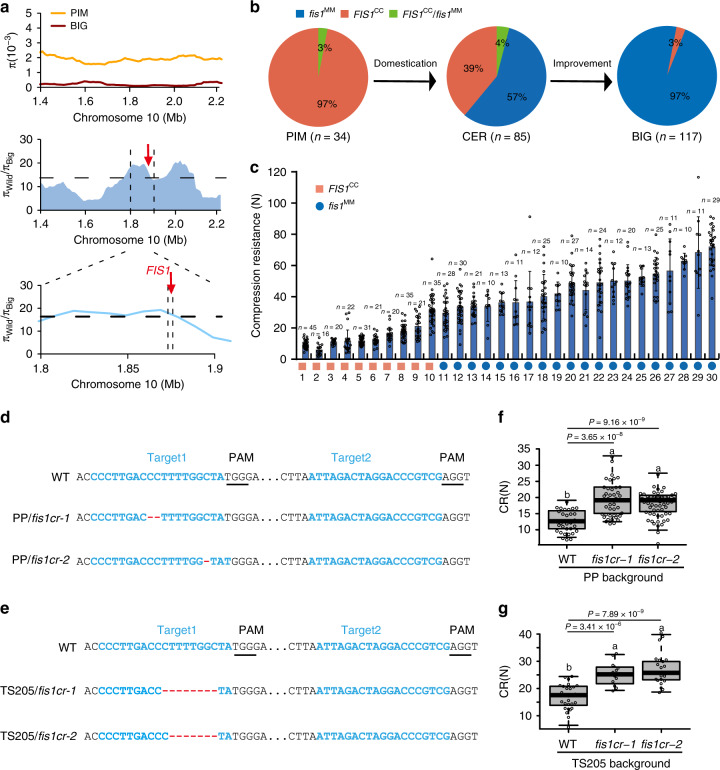
Fig. 5. FIS1 is selected during tomato domestication and is a target for the improvement of fruit firmness.
a Scan for selection signature surrounding the FIS1 gene. Top: nucleotide diversity (π) of wild species (orange line) and big-fruit cultivars (red line). Middle: π ratio of the wild species to big-fruit cultivars (blue region) for a region on chromosome 10. The horizontal dashed lines indicate the genome-wide top 5% ratio cutoff for candidate domestication sweeps. The vertical black dashed lines (bottom) delimit FIS1. b Frequency distribution of the FIS1 genotype in natural populations including 236 resequenced tomato accessions. PIM: Solanum pimpinellifolium, CER: S. lycopersicum var. cerasiforme, BIG: Big-fruit tomatoes. c CR of 20 cultivated tomatoes with the fis1MM allele and 10 cherry tomatoes with the FIS1CC allele. Error bars, mean ± SD. n = fruit number. d FIS1 mutations generated by CRISPR-Cas9 using two single-guide RNAs in PP. Blue lines indicate the target sites of the guide RNAs. Black lines indicate the protospacer-adjacent motif (PAM). The sequences of PP/fis1cr-1/2 mutants are shown. e FIS1 mutations generated by CRISPR/Cas9 using two single-guide RNAs in TS205. The sequences of TS205/fis1cr-1/2 mutants are shown. f Box plots of red ripe fruit CR for PP/fis1cr-1/2 mutants and PP. n = 31, 42, and 58 fruits. Box edges represent the 0.25 and 0.75 quantiles, and the bold lines indicate median values. Whiskers indicate 1.5 times the interquartile range. Different letters indicate significant differences according to the Tukey–Kramer test (P < 0.05). g Box plots of red ripe fruit CR for TS205/fis1cr-1/2 mutants and TS205. n = 28, 12, and 23 fruits. Box edges represent the 0.25 and 0.75 quantiles and the bold lines indicate median values. Whiskers indicate 1.5 times the interquartile range. Different letters indicate significant differences according to the Tukey–Kramer test (P < 0.05).

