Figure 4.
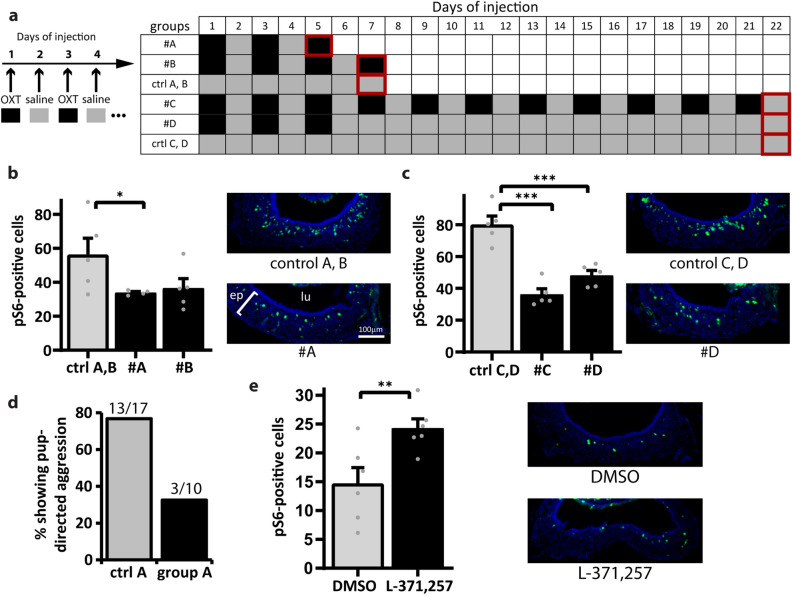
Manipulation of oxytocin function alters VNO activity in male mice exposed to pup odors. (a) Regimens of oxytocin (agonist) intraperitoneal injections in adult virgin mice. OXT oxytocin. Numbers represent days since the first injection. Black cells (right) represent days with oxytocin injection; gray cells indicate days with saline injection. Groups #A and #B represent situations where oxytocin is injected for a few days and the animals are analyzed immediately after. Group #C includes animals subjected to long-term oxytocin injection for 21 days. Group #D has mice injected with oxytocin for a few days followed by several days without oxytocin injection prior to analysis. Cells with red outlines are days when injected virgin animals were exposed to pup odors, evaluated for pup-directed aggressive behavior and euthanized to harvest VNOs for activity assays. (b) Number of active VNO cells (normalized to 50,000 μm2 of sensory epithelium), as judged by pS6 immunostaining (green fluorescence in representative VNO coronal section images on the right), after exposure of injected virgin animals in groups #A or #B to pup odors. DAPI nuclear stain is shown in blue. n = 4–5 animals; 3–6 sections per animal; gray dots represent values for individual mice. See Supplementary Table S1 for statistical test metrics and means across all sections. (c) Similar to (b), but for injected virgin animals in groups #C and #D, according to regimens in panel (a). n = 5 animals; 3–6 sections per animal. (d) Percentage of subjects displaying pup-directed aggression in control (n = 17 mice) and oxytocin-injected (n = 10 mice) virgin animals (group #A). For each group, the number of aggressive individuals out of all mice assayed is represented above the bar. (e) Left panel: number of pS6-positive cells in the VNO (normalized to 50,000 μm2 of sensory epithelium) from dpc15 animals injected with oxytocin receptor antagonist L-371,257 (n = 6 mice) or DMSO (control; n = 6 mice). Right panel, corresponding representative images of VNO coronal sections subjected to pS6 staining. Ep VNO epithelium, lu VNO lumen. *P < 0.05, **P < 0.01, ***P < 0.001; one-tailed Welch's t test assuming unequal variances. Bar is 100 μm.

