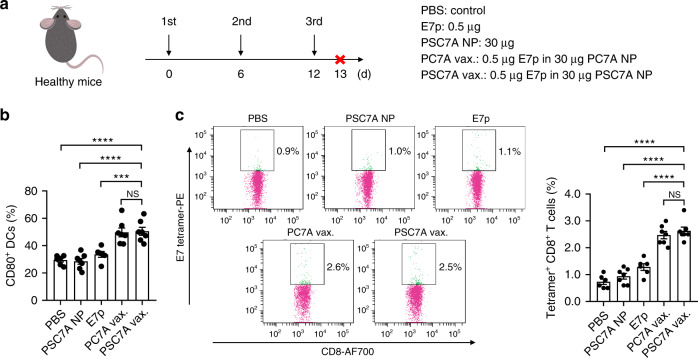
Fig. 3. PSC7A nanovaccine increases the percentage of CD80+ dendritic cells and tetramer+ CD8+ T cells in vivo.
a C57BL/6 healthy mice were treated with PBS, E7p, PSC7A NP, and PC7A vaccine (PC7A vax.) or PSC7A vaccine (PSC7A vax.) three times in 6 day intervals. One day after the last administration (on day 13), the mice were sacrificed and lymph nodes were harvested for flow cytometry analysis. b Summary of percentage of CD80+ DCs in inguinal lymph nodes 1 day after the last administration. n = 6 biologically independent mouse samples in each PBS and E7p group. n = 7 biologically independent mouse samples in each PSC7A NP, PC7A vaccine, and PSC7A vaccine group. Data are presented as means ± s.e.m. and statistical significance was calculated using Student’s two-tailed t-test (PSC7A vax. vs. E7p: ***P = 0.0008, PSC7A vax. vs. PSC7A NP: ****P < 0.0001, PSC7A vax. vs. PBS: ****P < 0.0001). c Representative flow dot plots of E7 tetramer staining of CD8+ T cells in lymph nodes and summary of percentage of E7 tetramer+ CD8+ T cells measured by flow cytometry. n = 6 biologically independent mouse samples in each PBS and E7p group. n = 7 biologically independent mouse samples in each PSC7A NP, PC7A vaccine, and PSC7A vaccine group. Data are presented as means ± s.e.m. and statistical significance was calculated using Student’s two-tailed t test (PSC7A vax. vs. E7p: ****P < 0.0001, PSC7A vax. vs. PSC7A NP: ****P < 0.0001, PSC7A vax. vs. PBS: ****P < 0.0001).

