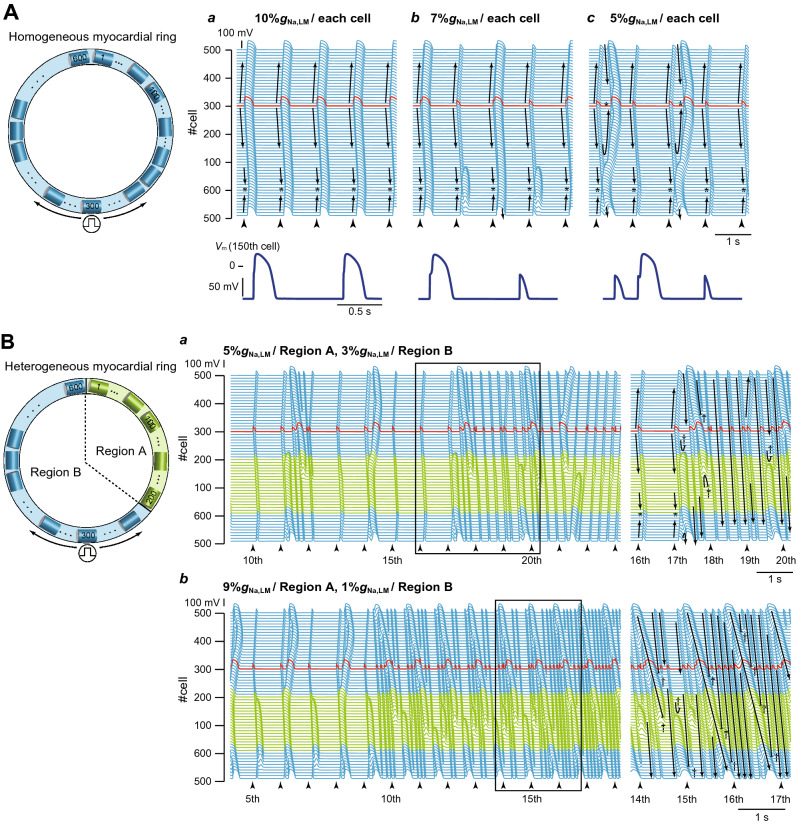
Figure 6.

Rotatory reentry induction in the myocardial ring model. (A) Overall views (top) of simulated AP propagations in the myocardial ring with spatially-homogeneous Na+ channel distribution with 10%gNa,LM (a), 7%gNa,LM (b), and 5%gNa,LM (c) in the lateral membrane (LM) segment of each myocyte and enlarged views (bottom) of the time-dependent behaviours of membrane potential (Vm) of the 150th myocyte. (B) Overall (left) and enlarged views (right) of simulated AP propagations in the same model but with a spatially-heterogeneous Na+ channel distribution with gNa,LM in the LM of the 1st to 200th myocytes (Region A) and of the 201st to 600th myocytes (Region B): 5%gNa,LM in Region A and 3%gNa,LM in Region B (a) and 9%gNa,LM in Region A and 1%gNa,LM in Region B (b). Arrows and black short bars indicate the direction of AP propagation and blockage, respectively. Asterisks and dagger symbols represent the collision of excitation wavefronts, and the blockade of AP propagation, respectively. The red trace represents the AP behavior at the stimulus site (cell #300). (C) A phase diagram of AP propagation patterns for the %gNa,LM of each myocyte within Region A vs. %gNa,LM of each myocyte within Region B. Open circles labeled as a–c correspond to the parameter sets at which the AP propagation patterns shown in Aa–c occurred. Open circles labeled as (d) and (e) show the parameter sets for (Ba,b).

