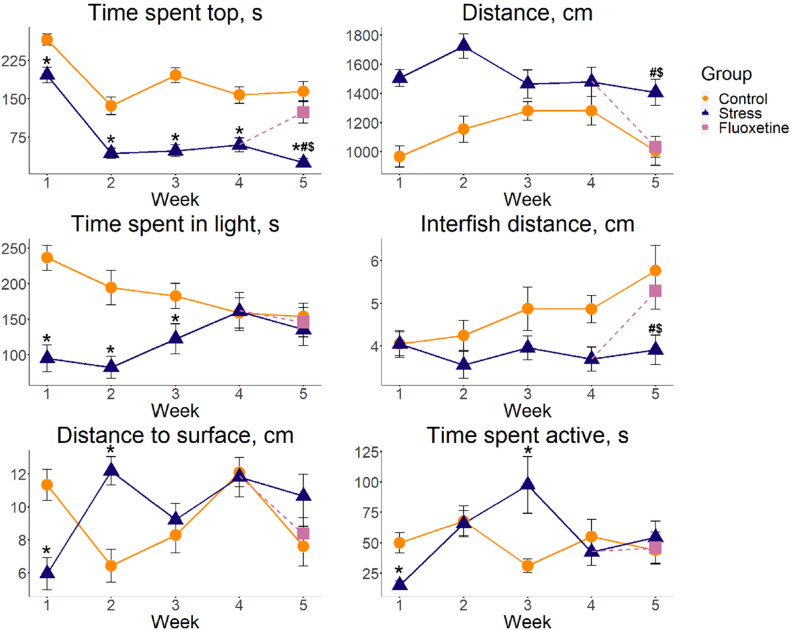
Figure 2.
Weekly dynamics of behavioral alterations induced by chronic unpredictable stress (CUS) exposure and fluoxetine treatment in adult zebrafish tested in the novel tank test (time spent in top and distance traveled), the light–dark test (time spent in light), shoaling test (average inter-fish distance and distance to water surface) and the zebrafish tail immobilization test (ZTI, time spent active). Data is represented as mean ± S.E.M. (n = 20 in weeks 1–3 and n = 15 in weeks 4–5), *p < 0.05 control vs. stress, post-hoc Tukey’s test for significant Wald Chi-squared test (ANOVA Type II) for GZLM1 for group (control and stress), week (1–5) and their interaction as predictors, #p < 0.05 stress vs. control group and $p < 0.05 fluoxetine vs. stress group, post-hoc Tukey’s test for significant Wald Chi-squared test ANOVA (Type II) for GZLM2 for group (control, stress and fluoxetine) at week 5 as predictor. Graphs were constructed using the ggplot2 R package137, also see Tables 2 and 3 and Supplementary Tables S1–S5 for statistical details.

