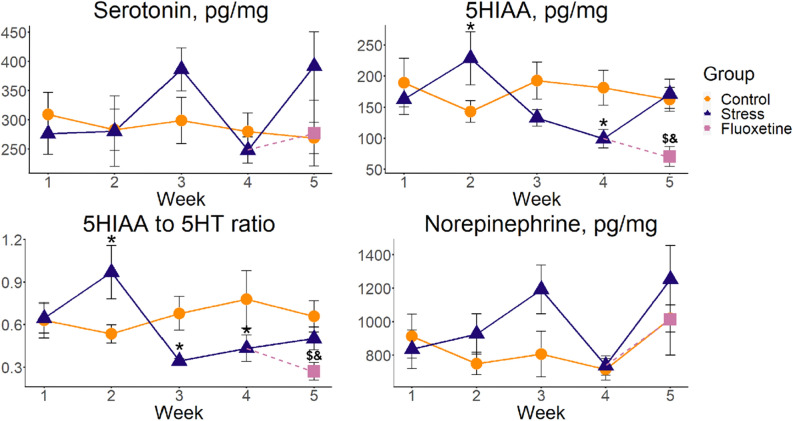
Figure 3.
Weekly dynamics of neurochemical alterations induced by chronic unpredictable stress (CUS) exposure and fluoxetine treatment, assessed by HPLC in the whole-brain samples of adult zebrafish (n = 10). Data are represented as mean ± S.E.M. *p < 0.05 control vs. stress, post-hoc Tukey’s test for significant Wald Chi-squared test ANOVA (Type II) for GZLM1 for group (control and stress), week (1–5) and their interaction as predictors, #p < 0.05 stress vs. control group and $p < 0.05 fluoxetine vs. stress group and &p < 0.05 fluoxetine vs. control, post-hoc Tukey’s test for significant Wald Chi-squared test ANOVA (Type II) for GZLM2 using group (control, stress and fluoxetine) at week 5 as predictor. Graphs were constructed using the ggplot2 R package137, also see Tables 2 and 3 and Supplementary Tables S1–S5 for statistical details.

