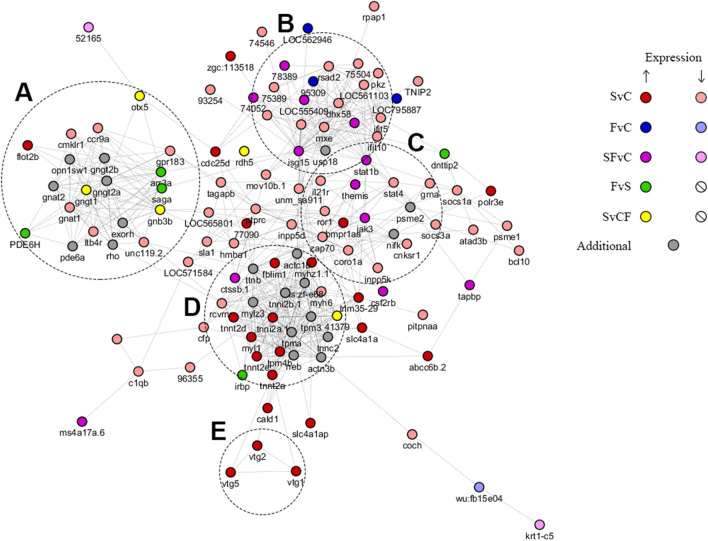
Figure 4.
The network of protein–protein interactions (PPI) constructed for differentially expressed genes (found in all analyses) using the STRING online database151 (see “Methods” section and Supplementary Figs. S1–S3 for details). Genes represented as numbers refer to “ENSDARG000000*”, where * denotes the last 5 digits of the Ensembl gene names (ID). The network was visualized using the CytoScape application149,150. SvC stress vs. control, FvC fluoxetine vs. stress, SFvC differentially expressed in both SvC and FvC (in same l2fc direction), FvS fluoxetine vs. stress, SvCF differentially expressed in SvC and FvS (in opposite directions, color refers to the direction of FvS expression change), Additional—20 proteins with the highest interaction score in STRING for suggested PPI networks. Letters denote several clusters of genes, including (A) arrestins and G protein-coupled receptors (GPCRs) related genes, (B) ubiquitin-related genes and their inflammatory modulators, (C) inflammation-related transcription factors, (D) cytoskeletal and motility related proteins, (E) vitellogenins.

