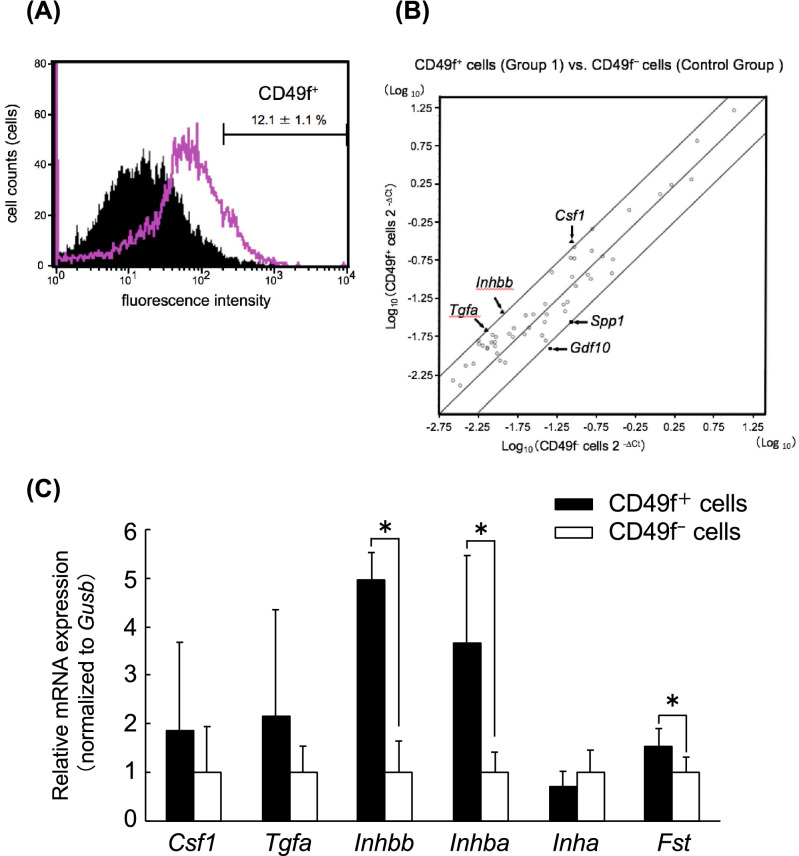
Figure 1.
(A) Flow-cytometric analysis of the CD49f+ cell fraction of freshly isolated cells from salivary glands of 5-week-old male mice. The pink-line area shows how the cells reacted to the CD49f antibody, while the black area is the negative control group with the isotype control antibody. One set of experiments was performed using the pooled cells from salivary glands of 3 mice, and the value represents the ratio of CD49f+ fractions from 3 sets of experiments. A typical image is shown. (B) Overview of scatter plot on 84 spotted genes in the Mouse Growth Factors RT2 Profiler PCR Array by plotting log10 transformed 2-ΔCt values between freshly-isolated CD49f+ cells (y-axis) and CD49f- cells (x-axis). The central line indicates an unchanged gene expression, and the boundaries represent a threefold cut-off difference. Triangle dots represent upregulated genes, and square dots represent downregulated genes in CD49f+ cells, compared to CD49f- cells. The gene symbols are indicated as follows: Colony stimulating factor 1 (Csf1), Inhibin beta b (Inhbb), Transforming growth factor alpha (Tgfa), Secreted phosphoprotein 1 (Spp1), and Growth differentiation factor 10 (Gdf10). (C) RT-qPCR analysis for up-regulated genes is shown in (B) for freshly-isolated CD49f cells. mRNA quantities of Csf1, Tgfa, Inhbb, Inhba, Inha, and Follistatin (Fst) were determined relative to Glucuronidase beta (Gusb) by using the ΔΔCt method, and fold induction is shown. CD49f+ cells (solid bars), CD49f- cells (open bars). One set of experiments was performed using the total RNA extracted from CD49f+ and CD49f- cells fractionated from the salivary glands of 3 mice, and 3 sets of experiments carried out independently. *P < 0.05, Student’s t test.

