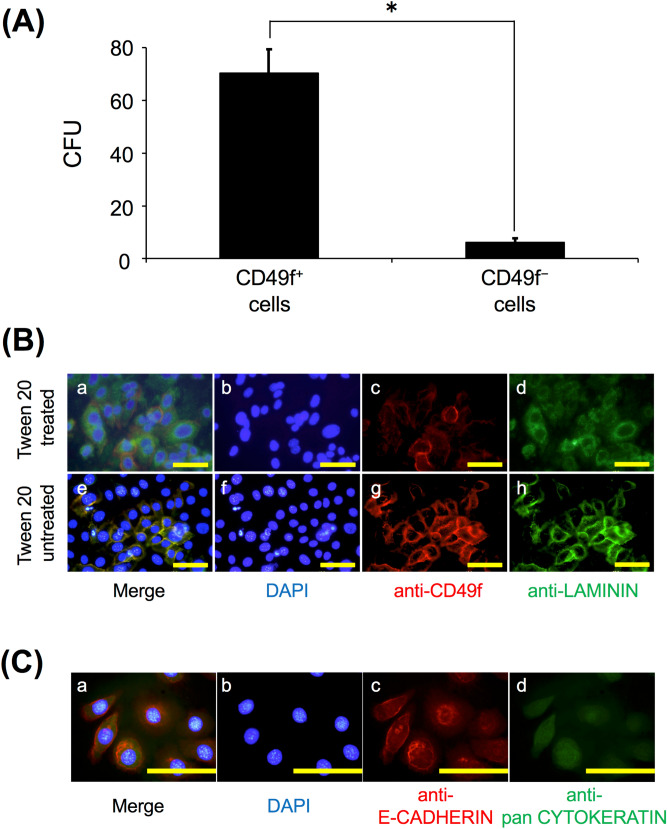
Figure 4.
(A) Colony forming units (CFU) of cultured CD49f+ cells and CD49f– cells at 8 days. The colonies consisting of more than 10 cells were counted. CD49f+ and CD49f- cells fractionated from the salivary glands of 3 mice were used per experiment, and 3 independent experiments were carried out. *P < 0.05, Student’s t test. (B) Immunostaining of CD49f cell surface marker and laminin. Fluorescent immunocytochemistry was performed on sub-cultured CD49f+ cells with Tween-20 (upper row; for both cytoplasm and cell surface) or without (lower row; for cell surface) on the same sections. The CD49f marker was stained red in (c) and (g); laminin was stained green in (d) and (h); nuclei were stained blue with DAPI in (b) and (f). Overlaid images of 2 sets of 3 images are colored yellow in (a) and (e). The experiment was performed using sub-cultured CD49f+ cells fractionated from the salivary glands of 3 mice, and 3 independent experiments were carried out, and a typical set of images is shown. Scale bar: 10 μm. (C) Immunostaining of E-cadherin and pan-cytokeratin. Fluorescent immunocytochemistry was performed on the same sections of cultured CD49f+ cells. E-cadherin was stained red in (c); pan-cytokeratin was stained green in (d); nuclei were stained blue with DAPI in (b). Overlaid image of 3 images is colored yellow in (a). The experiment was performed using sub-cultured CD49f+ cells fractionated from the salivary glands of 3 mice; 3 independent experiments were carried out, and a typical set of images is shown. Scale bar: 10 μm.

