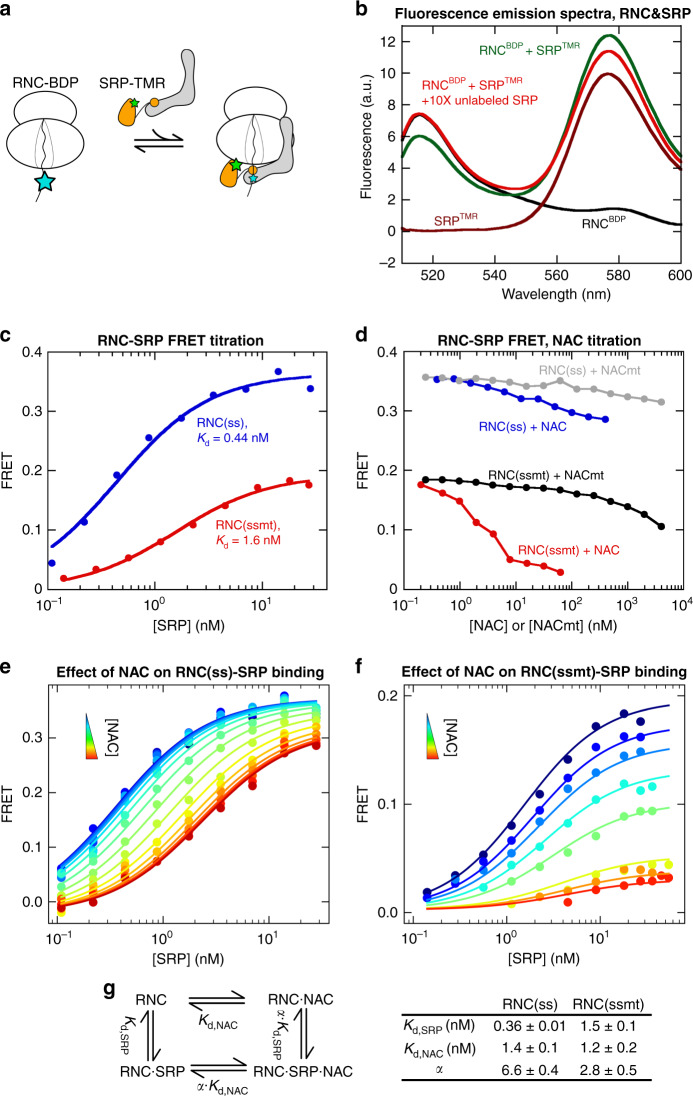
Fig. 3. An RNC-SRP binding assay shows that NAC co-binds with SRP on the ribosome.
a Scheme of the FRET assay to measure RNC-SRP binding. RNC was labeled with BDP (cyan star) at the N-terminus of signal sequence, and SRP was labeled with TMR (green star) at residue 12 of SRP54. b Fluorescence emission spectra showing FRET between RNC(ssmt)BDP and SRPTMR, using an excitation wavelength of 485 nm. Where indicated, the reactions contained 1 nM RNC(ssmt)BDP, 5 nM SRPTMR, and 50 nM unlabeled SRP. c Equilibrium titrations to measure the Kd of the RNC-SRP complex. Titrations contained 1 nM BDP-labeled RNC(ss) or RNC(ssmt) and indicated concentrations of SRPTMR. FRET efficiency was calculated using the fluorescence emission intensity at 517 nm according to Eq. (2). The lines are fits of the data to Eq. (4), which gave the indicated Kd values. d Effects of NAC and NACmt on the FRET efficiency between RNCBDP and SRPTMR. The reactions contained 1 nM BDP-labeled RNC(ss) or RNC(ssmt), 20 nM SRPTMR, and indicated concentrations of NAC or NACmt. e, f RNC-SRP FRET titrations in the presence of increasing NAC concentrations for RNC(ss) (e) and RNC(ssmt) (f). The titrations contained 1 nM RNCBDP, indicated concentrations of SRPTMR, 0–400 nM NAC (e) or 0–62.5 nM NAC (f). The lines are global fits of the data to the model in g using Eq. (8) in the Methods section. g Left panel: model for the coupled binding of SRP and NAC to the RNC. The same coupling factor α describes the degree to which SRP affects the RNC binding affinity of NAC and vice versa, as dictated by the principle of thermodynamic coupling. Right panel: summary of the parameters obtained from global fits of the data in e and f to Eq. (8). All values are reported as optimized value ± square root of covariance (equivalent to fitting error). Source data for b–f are provided in the Source Data file.

