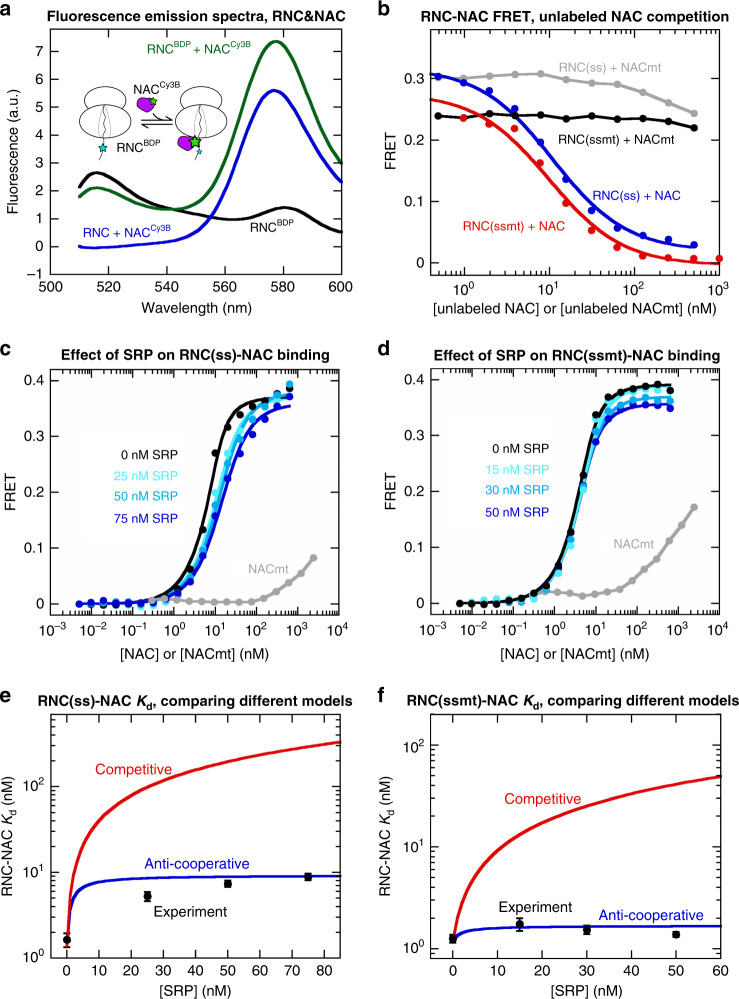
Fig. 4. An RNC-NAC binding assay shows co-binding of SRP and NAC on the RNC.
a Inset: scheme of the FRET assay to measure RNC-NAC binding. RNC was labeled with BDP (cyan star) at the N-terminus of signal sequence, and NAC was labeled with Cy3B (green star) at residue 57 of NACβ. Figure: Fluorescence emission spectra showing FRET between labeled RNC and NAC. Where indicated, the reactions contained 1 nM RNC(ss)BDP or 15 nM unlabeled RNC(ss) and 5 nM NACCy3B. The spectra were measured by excitation at 485 nm. b Competition assay to determine the RNC binding affinity of unlabeled NAC and NACmt. 1 nM RNCBDP and 20 nM NACCy3B were pre-incubated to form the RNCBDP-NACCy3B complex, followed by addition of unlabeled NAC or NACmt to compete with NACCy3B for RNC binding. The data with NAC were fit to Eq. (6) in the Methods, which gave Kd values of 0.55 and 0.50 nM for the binding of unlabeled NAC to RNC(ss) and RNC(ssmt), respectively. c, d Equilibrium titrations to measure the binding of NAC to RNC(ss) (c) and RNC(ssmt) (d) in the presence of increasing SRP concentrations. The reactions contained 5 nM RNCBDP and the indicated concentrations of NACCy3B, unlabeled NAC and SRP. The data were fit to Eq. (5) to obtain apparent Kd,NAC values at the individual SRP concentrations. e, f Comparison of the experimentally determined apparent Kd,NAC values at different SRP concentrations (black squares) with predictions from the anti-cooperative model in Fig. 3g (blue line, simulated using Eq. (10)) and the competitive model in Supplementary Fig. 4a (red line, simulated using Eq. (11)). The simulations in e used Kd,SRP, Kd,NAC and α values of 0.36 nM, 1.4 nM, and 6.6, respectively. The simulations in f used Kd,SRP, Kd,NAC and α values of 1.5 nM, 1.2 nM, and 1.4, respectively. The experimental data were shown as mean ± SD, with n = 3 independent measurements on the same biological sample. Source data for a–f are provided in the Source Data file.

