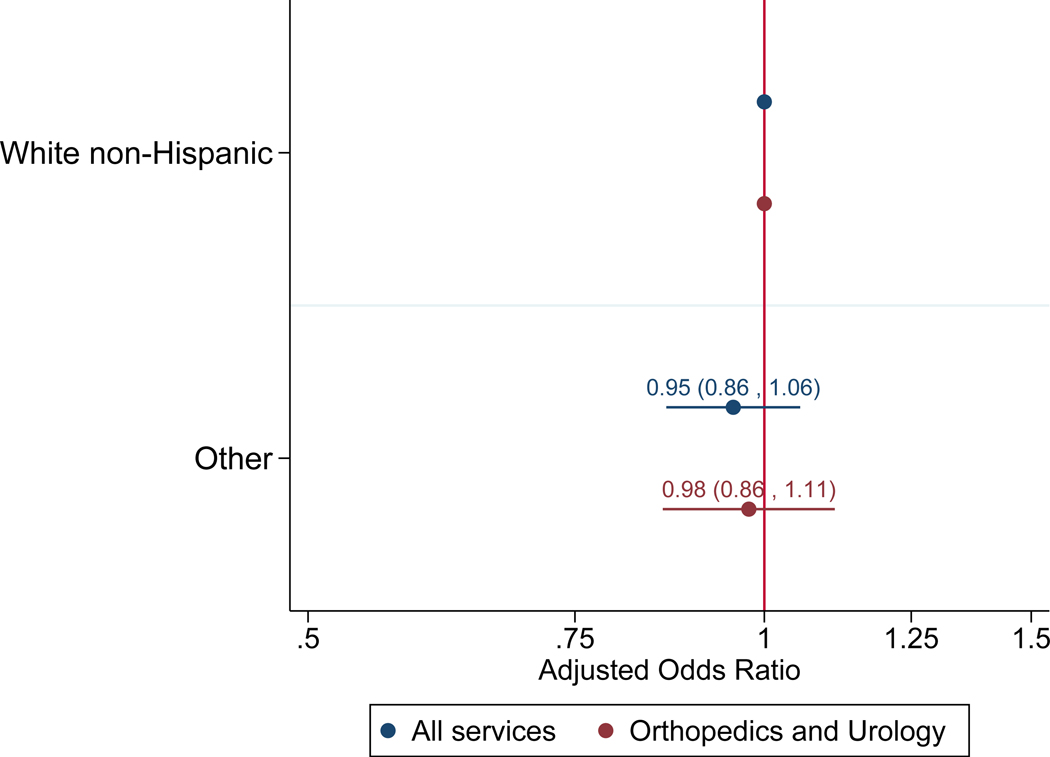
Figure 2:
Adjusted odds ratios of receiving intraoperative regional anesthesia for minority race and ethnic groups for all services in the main analysis (blue) and orthopedics and urology in sensitivity analysis (red). The white non-Hispanic group serves as the reference group. The numbers represent the adjusted odds ratios with lower and upper bounds of the 95% confidence intervals in parentheses.

