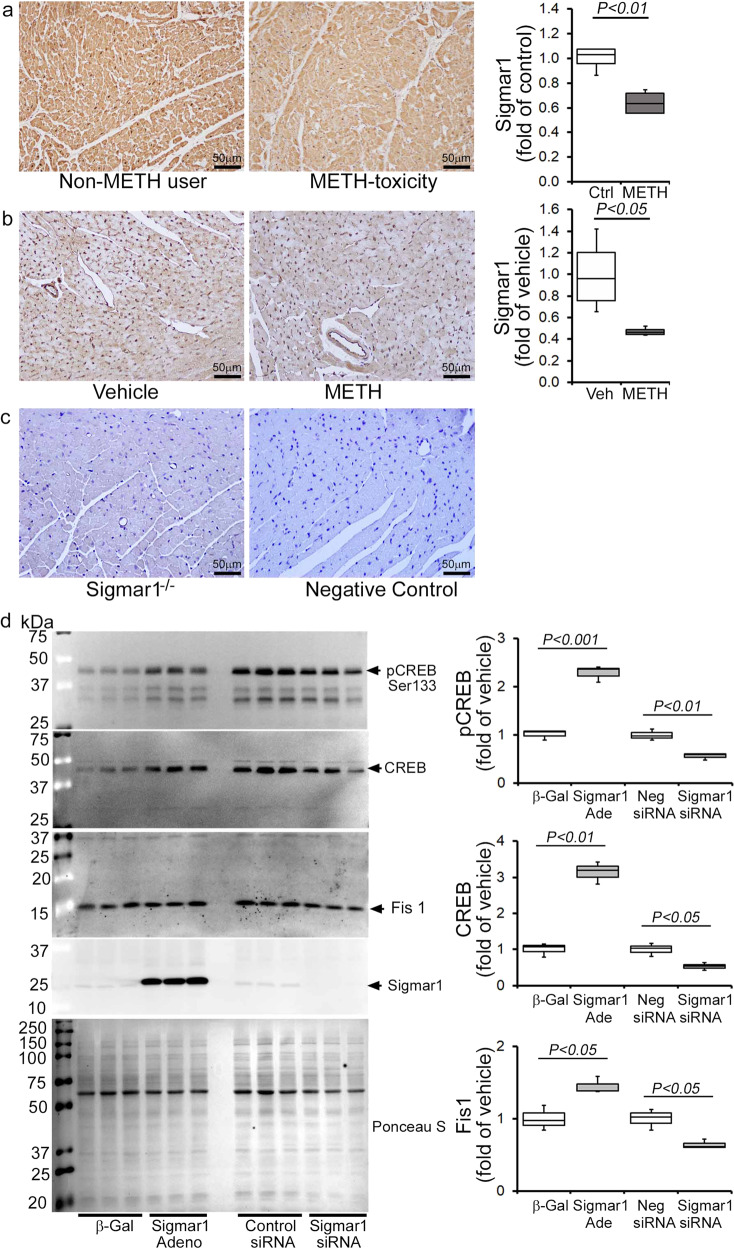
Fig. 10. METH treatment causes Sigmar1 expression-dependent regulation of CREB-Fis1 expression in cardiomyocytes.
a Left panel: representative micrographs of immunohistochemical detection of Sigmar1 (brown) in human non-METH user (n = 4), and METH toxicity (n = 4) LV heart sections. Hematoxylin (blue) was used to counterstain the nuclei. Right panel: fold change of DAB-positive Sigmar1 staining intensity in METH toxicity hearts compared to those of non-METH users. b Left panel: representative micrographs of immunohistochemical detection of Sigmar1 (brown) in the vehicle (n = 4), and METH-treated (n = 4) mouse LV sections. Right panel: fold change of DAB-positive Sigmar1 staining intensity in hearts treated with METH hearts compared with those treated with vehicle. c Left panel: global Sigmar1 knockout (Sigmar1−/−) mouse hearts were used to assess the specificity of the Sigmar1 primary antibody. Right panel: IgG stained slides without primary antibody incubation were used as a negative control. Representative micrographs are from three independent experiments. a–c Scale bar: 50 µm. d Sigmar1 was overexpressed and knocked down in NRC through adenovirus infection (10 MOI) and siRNA (50 nM) transfection, respectively. Right panel: western blot analyses showed that Sigmar1 overexpressed NRC exhibited increased CREB, pCREBSer133, and Fis1 expression, whereas knockdown of Sigmar1 yielded opposite results. Ponceau S staining of the transfer membranes was used to confirm equal loading and transfer across the gel. Left panel: bar graphs represent densitometric quantification of CREB, pCREBSer133, and Fis1 protein bands in cardiomyocytes. β-Gal adenovirus infection was used as the control for Sigmar1 adenovirus infection, whereas a non-specific siRNA was used as the control for Sigmar1 siRNA transfection. Data are representative of triplicates from two independent experiments. Boxes depict interquartile ranges, lines represent medians, and whiskers represent ranges. P values were determined using a one-way ANOVA, followed by Tukey’s multiple comparisons test. P < 0.05 between groups was considered statistically significant. β-Gal β-galactosidase; Adeno adenovirus, siRNA small interfering RNA, Veh, vehicle, METH methamphetamine, NS not significant.

