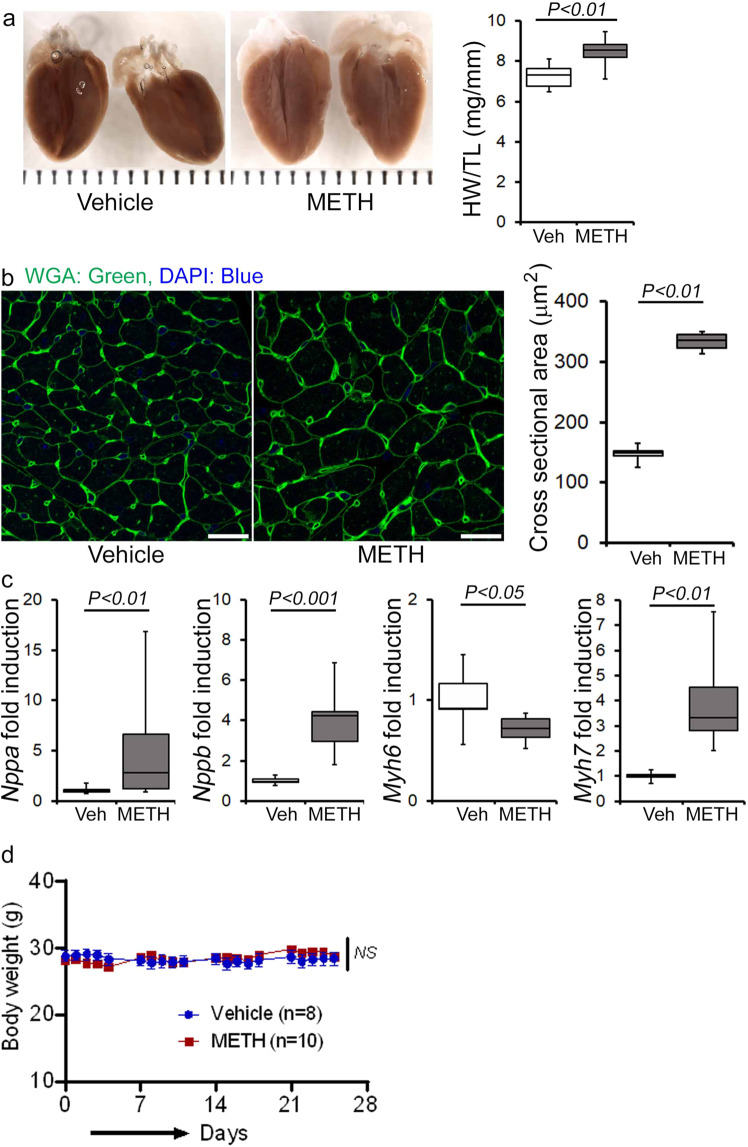
Fig. 4. METH “binge and crash” administration induces cardiac hypertrophy in mice.
a Left panel, stereomicroscope images showing the gross morphometry of whole heart cross-sections from vehicle- and METH-treated mice. Right panel: the box diagram represents increased gravimetric heart weight (mg)-to-tibia length (cm) ratio in the METH (n = 7) group compared with the vehicle (n = 7) group. b Left panel: representative fluorescent images of wheat germ agglutinin stained (WGA, green) LV myocardium. Nuclei were stained with DAPI (blue). Right panel: quantification of cardiomyocyte (CM) cross-sectional areas (µm2) showed increased CM areas in METH-treated mice (n = 1620 cardiomyocytes in six individual mice LV heart sections) compared with vehicle-treated mice (n = 1547 cardiomyocytes in five different mice LV heart sections) following 4 weeks of treatment. Scale bar: 50 µm. c mRNA expression of natriuretic peptide A (Nppa), natriuretic peptide B (Nppb), α-myosin heavy chain (Myh6), and β-myosin heavy chain (Myh7) expressed as the fold change in METH-treated hearts compared with vehicle-treated hearts. d Body weight (g) changes in vehicle (n = 8) and METH (n = 10) treated mice throughout the 4 weeks treatment period. Body weight data are expressed as mean ± SEM. Boxes depict interquartile ranges, lines represent medians, and whiskers represent ranges. P values were determined by two-tailed unpaired Student’s t test for a–c data. Two-way mixed effects ANOVA for repeated measures followed by Sidak’s multiple comparisons test was conducted to determine P value for d data. A P < 0.05 between groups considered statistically significant. Veh vehicle, METH methamphetamine.

