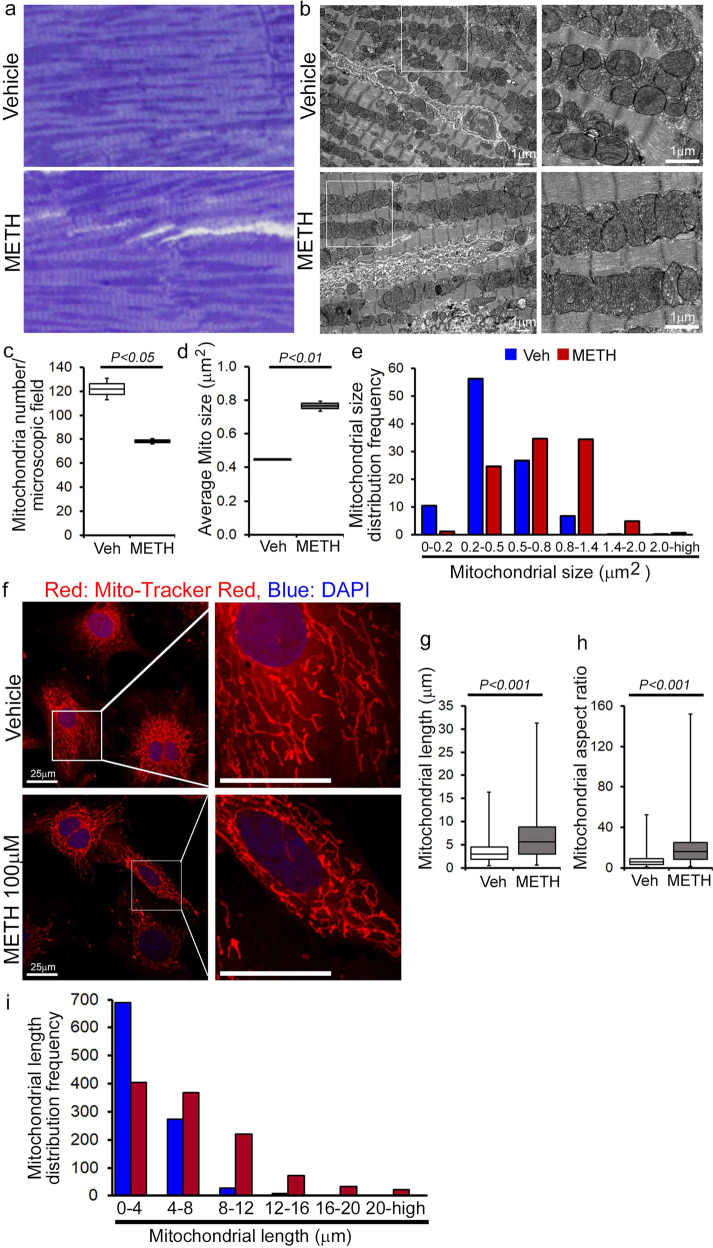
Fig. 7. METH treatment alters mitochondrial morphology in mouse hearts and isolated primary cardiomyocytes.
Representative a toluidine blue-stained and b transmission electron micrographs of vehicle- and METH-treated mouse LV heart sections show the preponderance of large, abnormally shaped mitochondria in the hearts of METH-treated mice. Scale bar: 1 µm. Bar graphs represent c the number of mitochondria per microscopic field, d average mitochondrial size (µm2), and e mitochondrial size (µm2) distribution frequency. Mitochondrial areas (µm2) were measured in 20 microscopic fields containing 2436 mitochondria from vehicle-treated mouse hearts (n = 2) and in 24 microscopic fields containing 1879 mitochondria from METH-treated mouse hearts (n = 2). f Representative fluorescent micrographs of Mitotracker Red staining used to visualize mitochondrial network morphology in cultured cardiomyocytes (NRC) following treatment with vehicle or METH (100 µM) for 24 hours. METH treatment resulted in visually distinct hyperfused mitochondria in cardiomyocytes compared with the mitochondria observed in the vehicle-treated group. Bar graphs represent g average mitochondrial network length (µm), h mitochondrial aspect ratio, and i mitochondrial length distribution frequency. Mitochondrial length (µm) and width (µm) were measured (>950 mitochondria for each treatment group) from three independent experiments in the cardiomyocytes of the vehicle- and METH-treated mice using NIH ImageJ (v1.6.0) software. Boxes depict interquartile ranges, lines represent medians, and whiskers represent ranges. P values were determined using a two-tailed unpaired Student’s t test. P< 0.05 between groups was considered statistically significant. Veh vehicle, METH methamphetamine.

