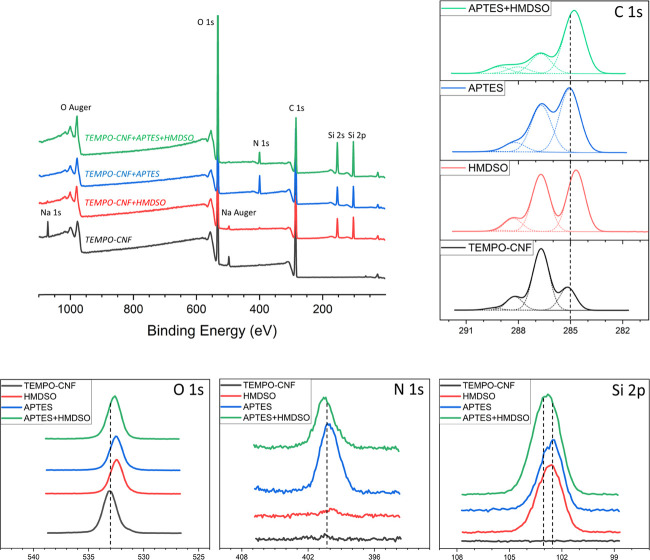
Figure 6.
Low-resolution XPS survey spectra showing signals due to emission of O 1s, C 1s, N 1s, Si 2s, and Si 2p electrons (top left); high-resolution XPS spectra of the C 1s (top right), O 1s, N 1s, and Si 2p regions (bottom) for untreated (black curve), HMDSO (red curve), APTES (blue curve), and hybrid APTES + HMDSO (green curve) plasma-deposited TEMPO-CNF films. (For interpretation of the references to color in this figure legend, the reader is referred to the web version of this article).

