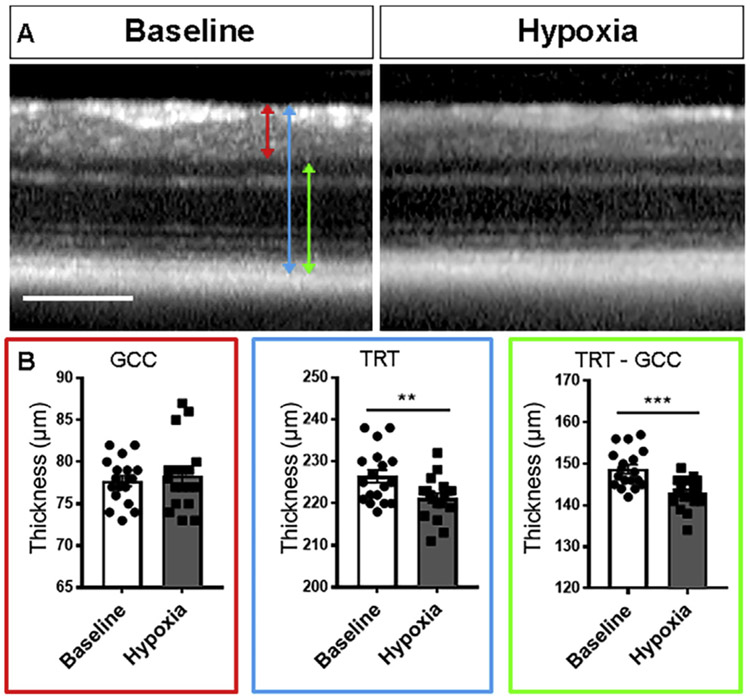
Fig. 1. No change in ganglion cell complex after 48h hypoxia.
A: High magnification of circle scans acquired using optical coherence tomography in vivo imaging before and after 48 h hypoxia. B: Bar graph of retinal thickness before and after hypoxia. Red line: ganglion cell complex (GCC); blue line: total retinal thickness (TRT); green line: TRT minus GCC. Scale bar: 200 μm.

