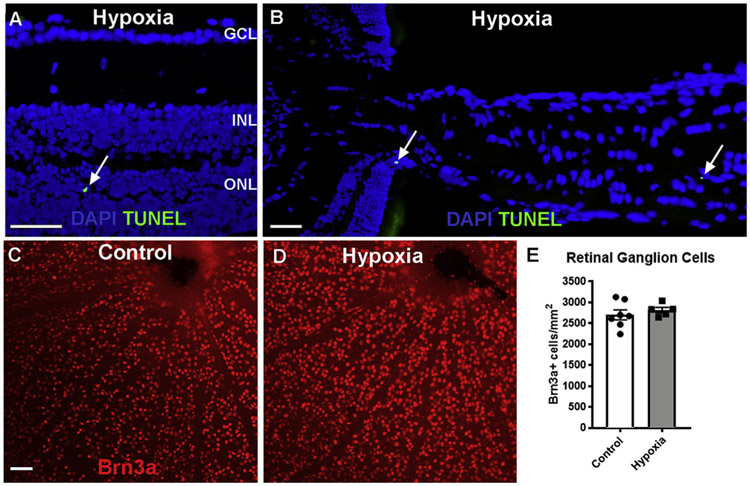
Fig. 2. Hypoxia led to little cell loss in the retina and optic nerve.
A-B: TUNEL staining (green, arrows) of a cross-section of retina (A) and optic nerve (B) after 48 h hypoxia. DAPI (blue) labeled nuclei. C-D: Retinal whole mount preparation of control and 48 h hypoxia eyes immunostained for Brn3a (red). E: bar graph of quantification of Brn3a+ cells in the retina of control and 48 h hypoxia groups. P = 0.2894 (unpaired t-test). Scale bar: 100 μm. GCL: ganglion cell layer; INL: inner nuclear layer; ONL: outer nuclear layer.

