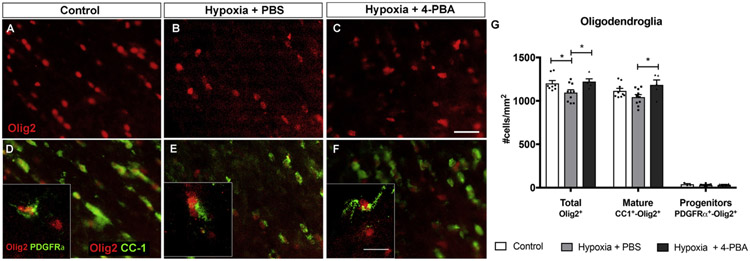
Fig. 4. Hypoxia led to significant loss of Olig2+ cells in the optic nerve, which was completely rescued with treatment with 4-PBA.
A-F: Representative images of total density of oligodendrocytes (Olig2+ cells, A-C), mature oligodendrocytes (CC-1+-Olig2+ cells, D-F), and oligodendrocyte progenitors (PDGFRα+-Olig2+ cells, box in D-F) in the optic nerve in control (A, D), 48 h hypoxia injected with PBS (B, E), and 48 h hypoxia treated with 4-PBA (C, F). G: Bar graph of different oligodendrocyte density in control, 48 h hypoxia injected with PBS, and 48 h hypoxia treated with 4-PBA. Compared with controls, there was significant loss of Olig2+ oligodendrocytes after 48 h hypoxia, and 4-PBA treatment led to significant increase in Olig2+ cells and CC-1+ cells. *P < 0.05, two-way ANOVA with Tukey's multiple comparisons test. Scale bar: 20 μm.

