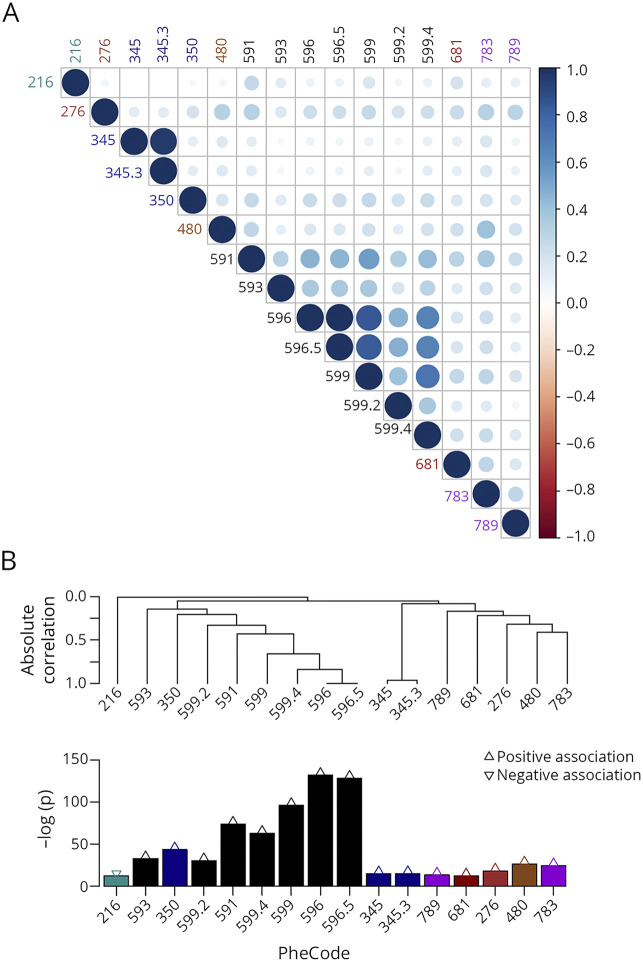
Figure 2. Correlation structure of the reported coexisting medical conditions (as indicated by PheCodes) associated with higher MS severity scores.
As shown in a heat map (A) and in a hierarchical clustering (B) format. The color saturation and the circle size in the heatmap both indicate the strength of (positive or negative) correlation between 2 medical conditions. Reporting criteria were defined as meeting the Bonferroni threshold of statistical significance and having the same direction of effect in both the discovery cohort and the extension cohort. Strength of association −log(p value) from the extension cohort is shown. Refer to table 2 for explanation of each phenotype code (PheCode).

