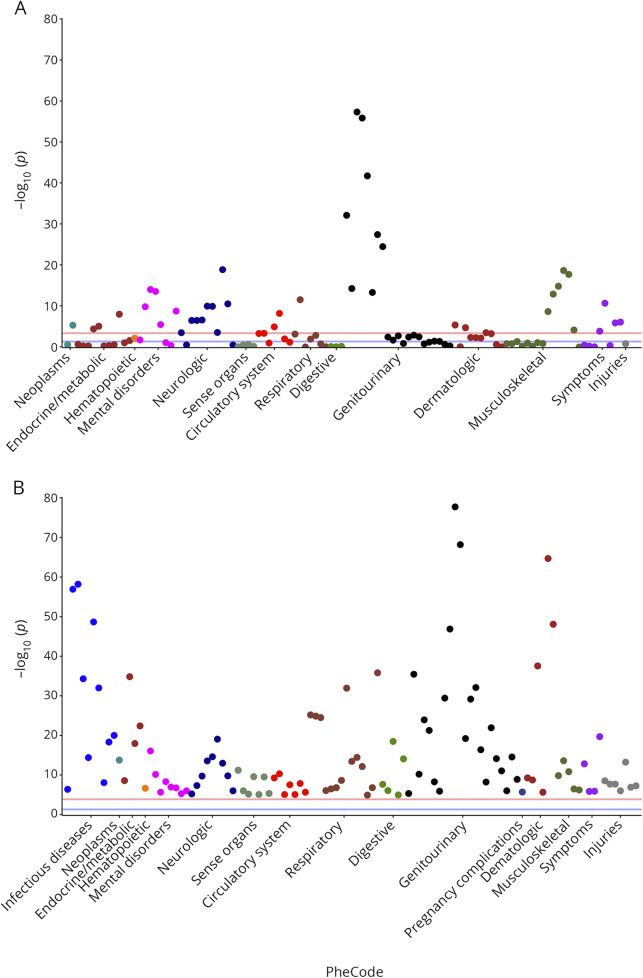
Figure 3. Manhattan plots of the mapped coexisting medical conditions associated with higher MS severity scores.
Conditions that met the requirement of minimum cases and respective –log (p values): findings from independent analysis in the discovery cohort (A) and extension cohort (B). Refer to table e-1 and table e-2 (links.lww.com/NXI/A294) for details of each condition. The red line indicates the threshold of significance after Bonferroni correction and covariate adjustment; the blue line represents p = 0.05.

